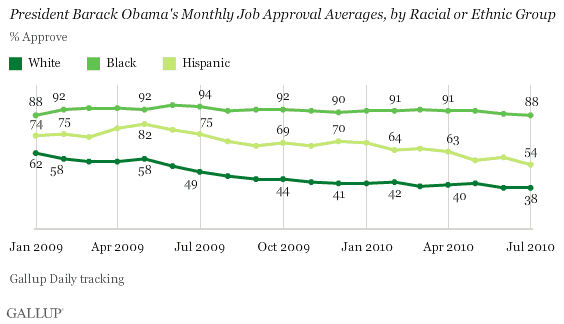
PRINCETON, NJ -- President Obama's job approval rating averaged 88% among blacks and 38% among whites in July, a 50-percentage-point difference that has been consistent in recent months but is much larger than in the initial months of the Obama presidency. Obama's job approval ratings among blacks, whites, and Hispanics in July are all at their lowest levels to date, although the overwhelming majority of blacks still approve.

Issues of race and the Obama presidency have been in the news again in recent weeks with the situation involving Shirley Sherrod, the black Department of Agriculture employee who was fired and then offered a new position at the agency after edited videos of a speech she made dealing with racial matters were widely circulated on the Internet.
Blacks' approval of the job Obama is doing dipped below the 90% threshold for the second month in a row in July; the 88% July average is the lowest monthly average approval rating blacks have given Obama yet, although not significantly lower than the 89% recorded in June.
The slight drop in blacks' ratings since May matches the pattern among whites and Hispanics. Obama's June and July ratings among whites are the lowest monthly ratings of his administration among that group, as is his 54% July rating among Hispanics.
Whites' approval of Obama is down 24 points from the high of 62% in January 2009. Hispanics' approval has dropped 28 points from its 82% peak in May 2009. Blacks' approval has been much more stable, falling seven points from the high of 95% in June 2009.
Clinton Also Had 90% Job Approval Among Blacks
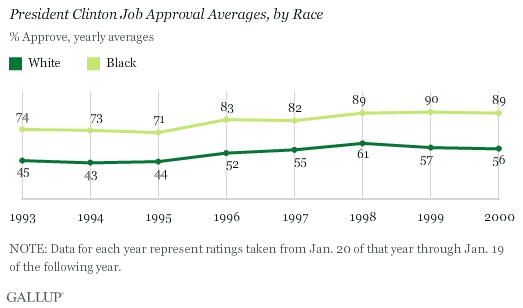
Obama's high ratings among black Americans are not unprecedented. Fellow Democrat Bill Clinton averaged 81% approval among blacks during his term in office, including 89% or 90% average approval in the last three years of his presidency.

However, the job approval gap between blacks and whites has become significantly larger in the Obama administration than it was in any year of the Clinton administration. Clinton received relatively low ratings among whites during his first years in office, but he also received ratings as low as 71%, on average, among blacks from 1995 to 1996. By contrast, Obama has consistently received much higher ratings among blacks even while his ratings among whites have been as low as or lower than those that Clinton received.
Overall, Obama Job Rating at 46%
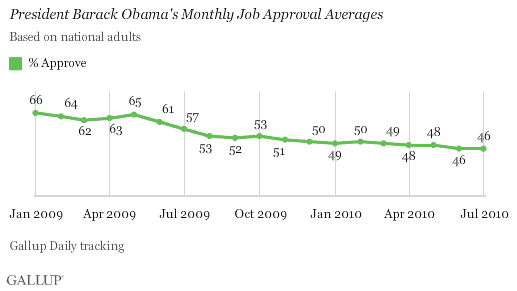
Obama's overall job approval rating in July is 46%, unchanged from June, and down four points from February of this year. Obama enjoyed his highest monthly average of 66% in January 2009, spanning his first 11 days in office, and was still at 65% in May 2009. His approval ratings then fell sharply between May and September of last year, down 13 points from 65% to 52% over a five-month span.

Explore Obama's approval ratings in-depth and compare to past presidents in the Gallup Presidential Job Approval Center.
Results are based on telephone interviews conducted as part of Gallup Daily tracking July 1-31, 2010, with a random sample of 15,467 adults, aged 18 and older, living in all 50 U.S. states and the District of Columbia, selected using random-digit-dial sampling.
For results based on the total sample of national adults, one can say with 95% confidence that the maximum margin of sampling error is ±1 percentage point.
For results based on the total sample of 12,347 non-Hispanic whites, one can say with 95% confidence that the maximum margin of sampling error is ±1 percentage point.
For results based on the total sample of 996 non-Hispanic blacks, one can say with 95% confidence that the maximum margin of sampling error is ±4 percentage points.
For results based on the total sample of 1,018 Hispanics, one can say with 95% confidence that the maximum margin of sampling error is ±4 percentage points.
Interviews are conducted with respondents on landline telephones and cellular phones, with interviews conducted in Spanish for respondents who are primarily Spanish-speaking. Each daily sample includes a minimum quota of 150 cell phone respondents and 850 landline respondents, with additional minimum quotas among landline respondents for gender within region. Landline respondents are chosen at random within each household on the basis of which member had the most recent birthday.
Samples are weighted by gender, age, race, Hispanic ethnicity, education, region, adults in the household, cell phone-only status, cell phone-mostly status, and phone lines. Demographic weighting targets are based on the March 2009 Current Population Survey figures for the aged 18 and older non-institutionalized population living in U.S. telephone households. All reported margins of sampling error include the computed design effects for weighting and sample design.
In addition to sampling error, question wording and practical difficulties in conducting surveys can introduce error or bias into the findings of public opinion polls.
For more details on Gallup's polling methodology, visit www.gallup.com.
