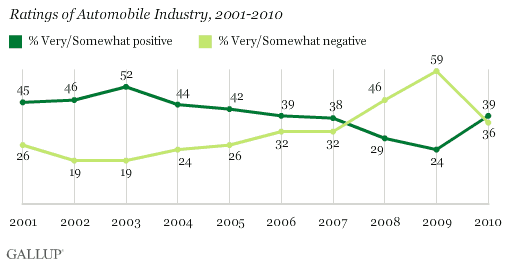
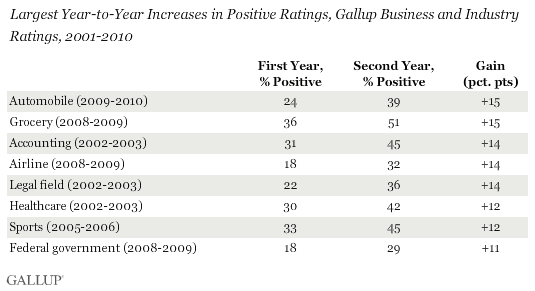
PRINCETON, NJ -- Americans' opinions of the automobile industry brightened considerably after reaching an all-time low last year, and now tilt more positive than negative for the first time in three years. The 15-point increase in the percentage rating the auto industry positively ties the largest one-year improvement in Gallup's 10-year history of measuring public opinion on major U.S. business industries.

Despite the improvement, the image of the auto industry has merely recovered from the losses of the past two years, and is much less favorable than it was in 2001-2005, when positive ratings significantly outnumbered negative ones.
The automobile industry's image suffered as the three major U.S. automakers struggled during the economic downturn, with all three asking the federal government for assistance in November 2008. The federal government eventually bailed out two of the Big Three automakers in 2009, General Motors and Chrysler, to prevent them from going under. U.S. automakers have had a stronger year in 2010, and GM is now planning to sell back much of its publicly held stock to private investors.
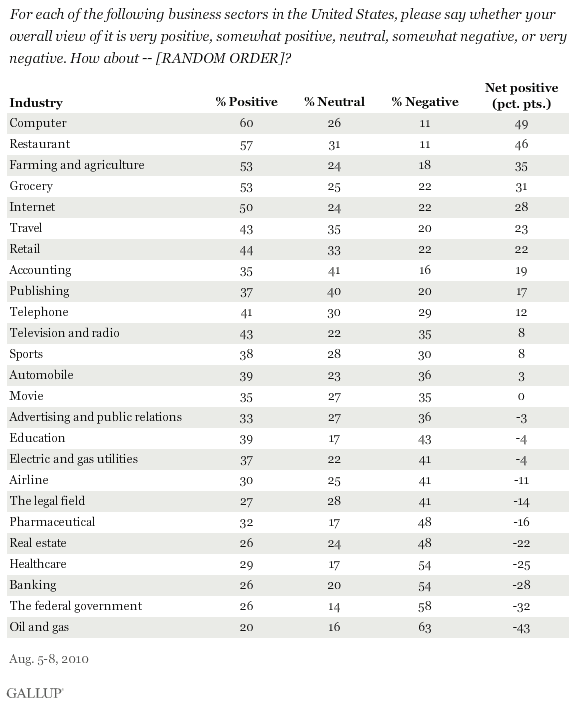
The automobile industry now ranks in the middle of the list of 25 business industries and sectors rated Aug. 5-8 in Gallup's annual Work and Education Poll. The computer and restaurant industries are rated most positively, while the oil and gas industry receives the worst ratings.
In addition to the computer and restaurant industries, farming and agriculture, grocery, and the Internet get at least 50% positive ratings. Healthcare, banking, and the federal government join the oil and gas industry with majority negative ratings.

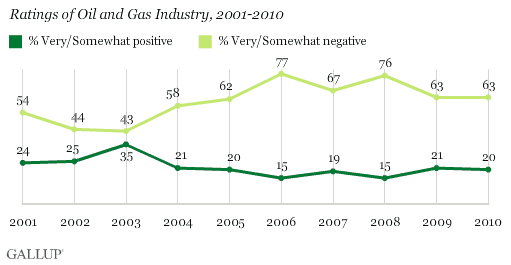
Either the computer or the restaurant industry has been the most positively rated industry each year Gallup has conducted the poll (though in 2005 both industries tied for the top spot with grocery, and farming and agriculture). Oil and gas has been the least positively rated industry each year except 2002, when the legal field held that unwelcome distinction.
The oil and gas industry has been the subject of negative news coverage this year as a result of the oil spill in the Gulf of Mexico. Still, the industry's image is unchanged, perhaps because its ratings were so negative to begin with. The oil and gas industry's image has been worse, including in 2006 and 2008, when gas prices were high.

Bottom Line
Americans' opinions of major U.S. industries and sectors have varied over the years in reaction to news events affecting a particular sector. For example, the accounting industry's image took a big hit in 2002 after several corporate accounting scandals, including Enron, came to light. Views of industries linked to energy production declined as gas prices rose in 2006, and the real estate industry's ratings tanked as the subprime mortgage crisis intensified.
Automobile and banking were the two industries most adversely affected by the recent recession, and Gallup documented significant decreases in the percentage of Americans viewing each positively. Positive views of the banking industry remain depressed, but the auto industry has regained much of the luster it lost over the past two years after an encouraging performance in the first half of 2010.
Results for this Gallup poll are based on telephone interviews conducted Aug. 5-8, 2010, with a random sample of 508 adults, aged 18 and older, living in the continental U.S., selected using random-digit-dial sampling.
For results based on the total sample of national adults, one can say with 95% confidence that the maximum margin of sampling error is ±5 percentage points.
Interviews are conducted with respondents on landline telephones (for respondents with a landline telephone) and cellular phones (for respondents who are cell phone-only). Each sample includes a minimum quota of 150 cell phone-only respondents and 850 landline respondents, with additional minimum quotas among landline respondents for gender within region. Landline respondents are chosen at random within each household on the basis of which member had the most recent birthday.
Samples are weighted by gender, age, race, education, region, and phone lines. Demographic weighting targets are based on the March 2009 Current Population Survey figures for the aged 18 and older non-institutionalized population living in continental U.S. telephone households. All reported margins of sampling error include the computed design effects for weighting and sample design.
In addition to sampling error, question wording and practical difficulties in conducting surveys can introduce error or bias into the findings of public opinion polls.
View methodology, full question results, and trend data.
For more details on Gallup's polling methodology, visit www.gallup.com.

