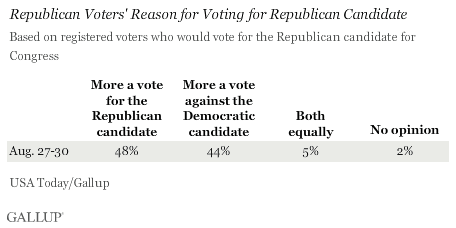
PRINCETON, NJ -- The Republicans' lead in the congressional generic ballot over the past month may be due as much to voters' rejecting the Democrats as embracing the Republicans. Among voters backing Republican candidates, 44% say their preference is "more a vote against the Democratic candidate," while 48% say it is "more a vote for the Republican candidate."

These results are based on the Aug. 27-30 USA Today/Gallup poll. Overall, the poll shows 49% of all registered voters preferring the Republican candidate in their district and 43% the Democratic candidate, using Gallup's generic congressional ballot. Republicans also led on the generic ballot, by a slightly larger 51% to 41% margin, in Gallup Daily tracking the week of Aug. 23-29.
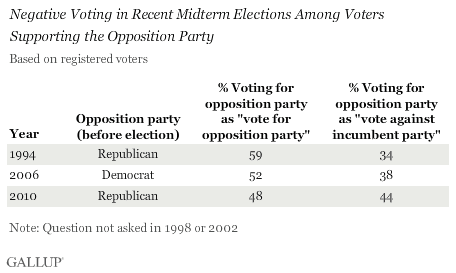
The 44% of Republican voters who say they are voting more against the Democratic candidate exceeds the level of negative voting against the incumbent party that Gallup measured in the 1994 and 2006 elections, when party control shifted (from the Democrats to the Republicans after the 1994 elections and from the Republicans to the Democrats after the 2006 elections).
In the fall of 1994, just prior to that year's elections, 34% of Republican voters said they were voting against the Democratic candidate rather than for the Republican candidate. There was a slightly higher proportion of negative voting in 2006, when 38% of Democratic voters said they were casting a ballot against the Republican candidate.

More Democratic Voters Voting "for the Democrat"
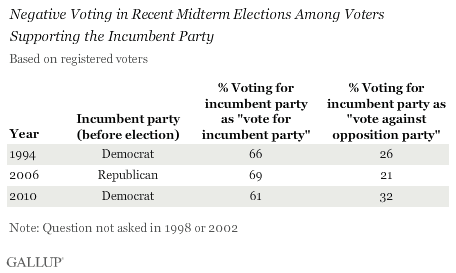
On a comparative basis, there is much less negative voting among Democratic voters this year than among Republican voters. Sixty-one percent of Democratic voters say they are voting to support their preferred party, while 32% are voting Democratic to reject the Republican Party.
These attitudes among Democrats are typical of what Gallup has found in past elections; the trailing/incumbent party's supporters have been much less likely to engage in negative voting than the leading/opposition party's supporters.

Specifically, there has been a maximum of 32% negative voting among the incumbent party's supporters but a minimum of 34% negative voting among the opposition party's supporters across the 1994, 2006, and 2010 elections.
These differences in negative voting suggest that the opposition party was ahead in these elections because its natural base of supporters was supplemented with voters who were disaffected with the incumbent party's performance. Meanwhile, the incumbent party's voters mainly consist of the party's core supporters, hence the lower degree of negative voting among this group.
Implications
Gallup finds a higher proportion of voting against the incumbent party than in past midterm election cycles, with close to half of Republican voters saying their vote is based on opposition to the Democrats. This reflects frustration with the direction of the country under President Obama and the Democratic Congress -- the poll finds 20% of Americans satisfied with the way thing are going in the country. Along the same lines, 35% of registered voters say they are more likely to vote for a candidate who opposes President Obama, while a smaller 27% say they are more likely to vote for a candidate who supports him.
Thus, it would appear the outcome of the elections hinge on how voters evaluate the performance of President Obama and the Democratic Party. To the extent that Democrats can improve these evaluations, they may be able to reduce the proportion of negative voting against their party and reduce the share of the Republican vote as well. The Republicans may strive to give voters reasons to vote "for" them, but the examples of past midterm elections suggest that negative voting may be the pivotal factor.
Results for this USA Today/Gallup poll are based on telephone interviews conducted Aug. 27-30, 2010, with a random sample of 1,021 adults, aged 18 and older, living in the continental U.S., selected using random-digit-dial sampling.
For results based on the total sample of national adults, one can say with 95% confidence that the maximum margin of sampling error is ±4 percentage points.
For results based on the sample of 928 registered voters, one can say with 95% confidence that the maximum margin of sampling error is ±4 percentage points.
For results based on the sample of 390 registered voters who would vote for the Democratic candidate for Congress if the election were held today, one can say with 95% confidence that the maximum margin of sampling error is ±6 percentage points.
For results based on the sample of 477 registered voters who would vote for the Republican candidate for Congress if the election were held today, one can say with 95% confidence that the maximum margin of sampling error is ±5 percentage points.
Interviews are conducted with respondents on landline telephones (for respondents with a landline telephone) and cellular phones (for respondents who are cell phone-only). Each sample of national adults includes a minimum quota of 150 cell phone-only respondents and 850 landline respondents, with additional minimum quotas among landline respondents for gender within region. Landline respondents are chosen at random within each household on the basis of which member had the most recent birthday.
Samples are weighted by gender, age, race, education, region, and phone lines. Demographic weighting targets are based on the March 2009 Current Population Survey figures for the aged 18 and older non-institutionalized population living in continental U.S. telephone households. All reported margins of sampling error include the computed design effects for weighting and sample design.
In addition to sampling error, question wording and practical difficulties in conducting surveys can introduce error or bias into the findings of public opinion polls.
View methodology, full question results, and trend data.
For more details on Gallup's polling methodology, visit www.gallup.com.
