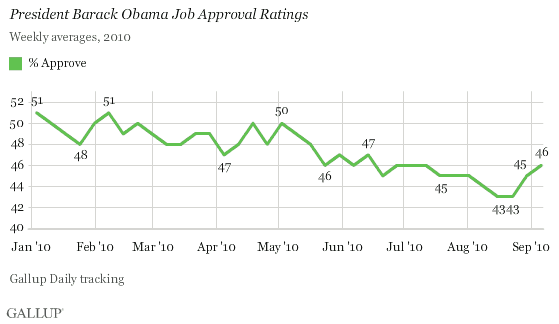
PRINCETON, NJ -- President Barack Obama's job approval rating averaged 46% for the week ending Sept. 12, his highest weekly average since mid-July and up from the 43% low point recorded in late August.

Obama began the year with approval ratings in the high 40% to low 50% range, including a 50% rating as recently as early May. His ratings fell as the summer began, bottoming out at 43% for two weeks in late August as controversy swirled over his reaction to the Islamic center proposed for lower Manhattan. They have since improved to 45% two weeks ago and 46% in the most recent week.
From a broader perspective, Obama's monthly job approval ratings have been through three distinctive phases since he took office in January 2009:
-
A "honeymoon phase," which lasted through roughly the spring of 2009, and during which the president's job approval ratings stayed in the low to mid-60% range
-
A period of sharp decline in the summer of 2009, amid the national healthcare debate, when Obama's monthly approval average dropped 13 points, from 65% in May to 52% in September
-
A more gradual decline in approval ratings over the last year, from the low 50% range in early fall of last year to the mid-40% range through the summer of this year

Obama's Areas of Strong and Weak Support
The president's job approval rating, as is the case for most presidents, remains highly differentiated across various political and demographic subgroups.
Obama does significantly better among those who identify as Democrats, liberals, and moderates, among blacks and Hispanics, the young, the unmarried, and those who don't attend church regularly, and those in the East. He does significantly worse among essentially the mirror images of those groups -- Republicans, conservatives, non-Hispanic whites, older, married, and religious Americans, and those living in the South.

These data highlight the major fault lines that divide presidential politics in today's political environment. Partisanship, ideology, race and ethnicity, age, marriage, income, education, and religiosity all are strongly predictive of one's position on the job Obama is doing as president.
Bottom Line
President Obama's job approval rating has been in a gradual decline since he took office in January 2009, descending from 52% last September to 44% last month.
All in all, the president's monthly average is down about 20 points since he took office. The path of Obama's approval ratings has not been a totally straight line, however. There are signs of a mild recovery in his ratings in September so far, and his current 46% weekly average is as high as any since mid-July. Still, if Obama's approval rating stays below 50% by the time of the early November midterm elections, his party is vulnerable to major seat losses in the House of Representatives.
Explore Obama's approval ratings in depth and compare them with those of past presidents in the Gallup Presidential Job Approval Center.
Results are based on telephone interviews conducted as part of Gallup Daily tracking survey Sept. 6-12, 2010, with a random sample of 3,490 adults, aged 18 and older, living in all 50 U.S. states and the District of Columbia, selected using random-digit-dial sampling.
For results based on the total sample of national adults, one can say with 95% confidence that the maximum margin of sampling error is ±2 percentage points.
For results based on the total monthly samples of approximately 15,000 national adults, one can say with 95% confidence that the maximum margin of sampling error is ±1 percentage point.
Interviews are conducted with respondents on landline telephones and cellular phones, with interviews conducted in Spanish for respondents who are primarily Spanish-speaking. Each daily sample includes a minimum quota of 150 cell phone respondents and 850 landline respondents, with additional minimum quotas among landline respondents for gender within region. Landline respondents are chosen at random within each household on the basis of which member had the most recent birthday.
Samples are weighted by gender, age, race, Hispanic ethnicity, education, region, adults in the household, cell phone-only status, cell phone-mostly status, and phone lines. Demographic weighting targets are based on the March 2009 Current Population Survey figures for the aged 18 and older non-institutionalized population living in U.S. telephone households. All reported margins of sampling error include the computed design effects for weighting and sample design.
In addition to sampling error, question wording and practical difficulties in conducting surveys can introduce error or bias into the findings of public opinion polls.
For more details on Gallup's polling methodology, visit https://www.gallup.com/.
