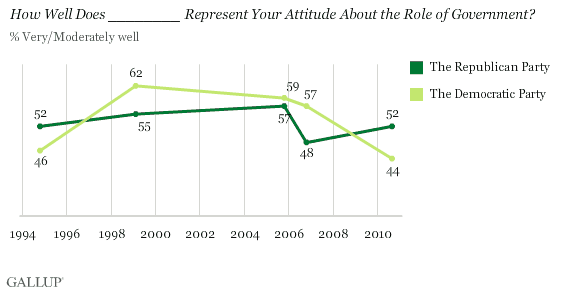
PRINCETON, NJ -- Americans' opinions about how well the Democratic Party represents their views on the role of government have soured in recent years. The percentage saying the party is doing either very or moderately well on this has dropped from 57% in October 2006 to 44% today. Over the same period, the Republican Party's image on the role of government has held fairly steady and, as a result, the GOP now leads on this dimension, similar to its position in October 1994.

More specifically, according to the Aug. 27-30 USA Today/Gallup survey, fewer than half of Americans, 44%, now say the Democratic Party represents their views on the role of government either very or moderately well, while 54% say it does this not very or not at all well. Americans are more evenly divided in their views of the Republican Party in this arena, with 52% generally saying it is doing well and 47% not well.
After the 1994 elections, which saw the Democrats lose majority control of Congress to the Republicans for the first time in nearly a half century, the Democrats went on to lead the Republicans on this measure in 1999, 2005, and 2006. The current reversal is yet another sign that a shake-up of the political balance in Washington may be looming.
Republicans Also Lead for Representing Values
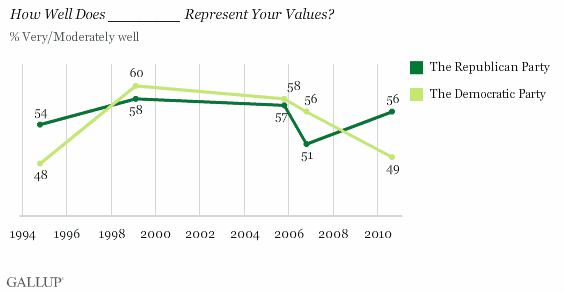
Americans' perceptions of how well each party represents their values show a similar trend. Democrats have lost ground on this dimension in recent years while Republicans have maintained their ground or possibly gained a little ground, resulting in a distinct Republican advantage, 56% to 49%, again similar to the parties' 1994 standing.

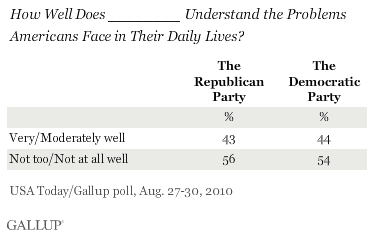
While the Republicans may have an edge on these two policy-oriented image perceptions, the parties are about tied in perceptions of how well each understands the problems Americans face in their daily lives. In answer to this party image item, first asked this year, the slight majority of Americans believe the Republicans and Democrats understand Americans' day-to-day problems either "not too well" or "not well at all."

Bottom Line
Americans' views on how well the two major parties reflect their views on the role of government and their values more broadly make clear that the Democrats' image has suffered since they won back control of Congress in 2006. Republicans have not made comparable perceptual gains in these areas, but largely as a result of the Democrats' losses, Republicans are now leading on both dimensions, similar to their standing in 1994.
Results for this USA Today/Gallup poll are based on telephone interviews conducted Aug. 27-30, 2010, with a random sample of 1,021 adults, aged 18 and older, living in the continental U.S., selected using random-digit-dial sampling.
For results based on the total sample of national adults, one can say with 95% confidence that the maximum margin of sampling error is ±4 percentage points.
Interviews are conducted with respondents on landline telephones (for respondents with a landline telephone) and cellular phones (for respondents who are cell phone-only). Each sample includes a minimum quota of 150 cell phone-only respondents and 850 landline respondents, with additional minimum quotas among landline respondents for gender within region. Landline respondents are chosen at random within each household on the basis of which member had the most recent birthday.
Samples are weighted by gender, age, race, education, region, and phone lines. Demographic weighting targets are based on the March 2009 Current Population Survey figures for the aged 18 and older non-institutionalized population living in continental U.S. telephone households. All reported margins of sampling error include the computed design effects for weighting and sample design.
In addition to sampling error, question wording and practical difficulties in conducting surveys can introduce error or bias into the findings of public opinion polls.
View methodology, full question results, and trend data.
For more details on Gallup's polling methodology, visit https://www.gallup.com/.
