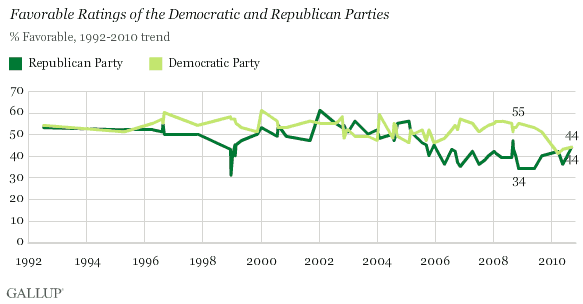
PRINCETON, NJ -- Americans' favorable ratings of the two major U.S. political parties are the same (44%), according to a Sept. 13-16 Gallup poll. In recent years, Republicans' ratings have generally improved and Democrats' have generally worsened.

Gallup has asked Americans since 1992 to say whether they have a favorable or unfavorable opinion of each political party. Historically, the Democratic Party has averaged a 53% favorable rating, compared with 46% for the Republican Party.
Thus, each party's current 44% favorable rating is below average from a historical perspective, particularly so for the Democrats. And the fact that the ratings are the same for both parties is also a departure from the norm.
As has been the case throughout this year, a majority of Americans view both parties unfavorably. Americans have had mostly negative views of the Republicans for the last five years. Prior to this year, though, a majority of Americans had never viewed the Democratic Party unfavorably.

Favorable Ratings by Political Affiliation
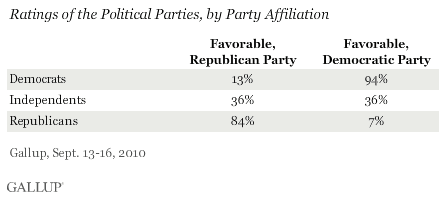
The poll shows identical percentages of independents giving each party a favorable rating (36%). Those who identify with either of the two parties naturally rate their preferred party much more positively than the other party, but partisans are notably more extreme in their views of the Democratic Party than of the Republican Party.

That pattern has been evident in each of the last two party favorable updates, but is not typical.
Bottom Line
With the 2010 midterm elections fast approaching, Americans have similarly negative views of the two major political parties. That is a distinct departure from the 2006 midterms, when a majority of Americans viewed the Democratic Party positively and the Republican Party negatively prior to the Democrats' regaining control of the House and Senate. Gallup has not historically asked party favorables prior to each midterm election, so it is not clear what the current results might predict for this fall's contests. But this is another sign that the Republicans' stronger positioning in voters' preferences this year is probably due more to voters' frustration or disappointment with the Democratic Party than to their embracing of the Republican Party.
Survey Methods
Results for this Gallup poll are based on telephone interviews conducted Sept. 13-16, 2010, with a random sample of 1,019 adults, aged 18 and older, living in the continental U.S., selected using random-digit-dial sampling.
For results based on the total sample of national adults, one can say with 95% confidence that the maximum margin of sampling error is ±4 percentage points.
Interviews are conducted with respondents on landline telephones (for respondents with a landline telephone) and cellular phones (for respondents who are cell phone-only). Each sample includes a minimum quota of 150 cell phone-only respondents and 850 landline respondents, with additional minimum quotas among landline respondents for gender within region. Landline respondents are chosen at random within each household on the basis of which member had the most recent birthday.
Samples are weighted by gender, age, race, education, region, and phone lines. Demographic weighting targets are based on the March 2009 Current Population Survey figures for the aged 18 and older non-institutionalized population living in continental U.S. telephone households. All reported margins of sampling error include the computed design effects for weighting and sample design.
In addition to sampling error, question wording and practical difficulties in conducting surveys can introduce error or bias into the findings of public opinion polls.
View methodology, full question results, and trend data.
For more details on Gallup's polling methodology, visit https://www.gallup.com/.
