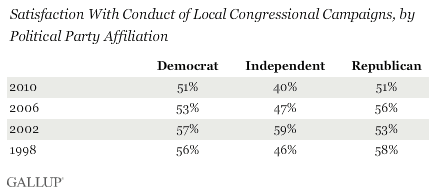
PRINCETON, NJ -- Americans are less satisfied with the way local congressional candidates are conducting their campaigns in 2010 than in any of the past four midterm election years. Though not appreciably different from the levels of satisfaction in 1998 and 2006, the current reading does mark the first time less than a majority are satisfied. Still, those who are satisfied continue to outnumber those who are dissatisfied.

These results are based on an Oct. 21-24 Gallup poll. Gallup has asked Americans to assess the congressional campaigns in late October in each of the last four midterm election years.
Among political groups, independents (40%) are the least satisfied with the way congressional candidates are conducting their campaigns, with Republicans and Democrats (51% each) equally satisfied.
That pattern of results has generally held in past election years, with 2002 a notable exception. In that year, independents were at least as satisfied as Republicans and Democrats.

Americans remain quite negative in their evaluations of a specific type of campaign activity: television commercials for candidates for political office. Seventy-nine percent say most of the ads they have seen have been negative, including 46% who say "very" or "extremely negative." Only 14% describe the commercials as positive.
The 46% of Americans who say the ads have been very or extremely negative is similar to what Gallup measured in the 2006 campaign, when 49% evaluated the ads this negatively. Americans were less likely to see the political ads as highly negative in 2002.

Republicans, Democrats, and independents rate the political commercials they have seen about equally negatively. This has generally been the case in past midterm elections.
Bottom Line
The 2010 campaign has been intense, with Democrats trying to maintain the majority status in Congress they have enjoyed the last four years, even as Republicans -- fueled in part by the Tea Party movement -- see a real chance for winning control of the House and possibly the Senate. The campaign has also been notable for the ads sponsored by unaffiliated advocacy groups endorsing particular candidates.
Americans do express slightly less satisfaction with the way local candidates for Congress are conducting their campaigns than they have in past midterm election years, but nothing too different from their satisfaction in the past. And more Americans continue to say they are satisfied than dissatisfied with the campaigns.
Learn more about Gallup's likely voter models for the 2010 midterm congressional elections.
Survey Methods
Results for this Gallup poll are based on telephone interviews conducted Oct. 21-24, 2010, with a random sample of 1,021 adults, aged 18 and older, living in the continental U.S., selected using random-digit-dial sampling.
Results for both questions here are based on interviews with a half sample of approximately 500 national adults each.
For results based on these total samples of national adults, one can say with 95% confidence that the maximum margin of sampling error is ±5 percentage points.
Interviews are conducted with respondents on landline telephones (for respondents with a landline telephone) and cellular phones (for respondents who are cell phone-only). Each sample includes a minimum quota of 150 cell phone-only respondents and 850 landline respondents, with additional minimum quotas among landline respondents for gender within region. Landline respondents are chosen at random within each household on the basis of which member had the most recent birthday.
Samples are weighted by gender, age, race, education, region, and phone lines. Demographic weighting targets are based on the March 2009 Current Population Survey figures for the aged 18 and older non-institutionalized population living in continental U.S. telephone households. All reported margins of sampling error include the computed design effects for weighting and sample design.
In addition to sampling error, question wording and practical difficulties in conducting surveys can introduce error or bias into the findings of public opinion polls.
View methodology, full question results, and trend data.
For more details on Gallup's polling methodology, visit www.gallup.com.
