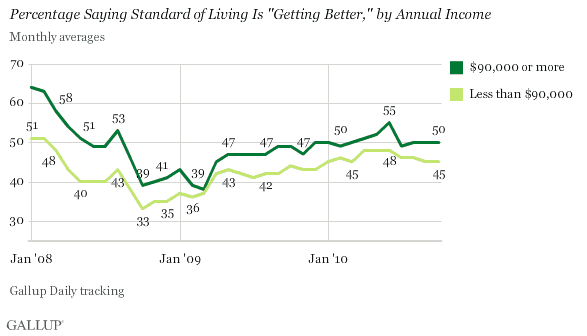
PRINCETON, NJ -- Despite an 11% increase in the Dow during September and October, Americans' standard-of-living optimism has remained flat over the same period, with 50% of upper-income Americans saying their standard of living is "getting better" in October -- unchanged from the prior three months and a year ago. Similarly, 45% of lower- and middle-income Americans say their standard of living is getting better -- essentially the same as readings from the prior three months and October 2009.

The percentage of Americans saying their standard of living was getting better declined as the recession deepened in 2008. In fact, as the financial crisis worsened, making the recession even more pronounced during late 2008 and early 2009, upper-income Americans' optimism about their standard of living declined to the point that it matched that of their lower- and middle-income counterparts. By October 2009, standard-of-living of optimism had increased across income groups to the level at which it stands today.
Standard of Living Optimism Largely Unchanged Across Ages and Regions
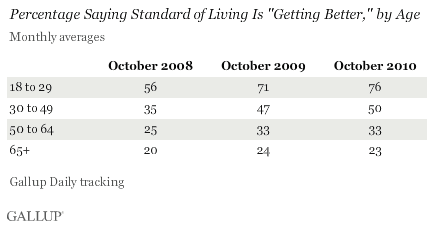
Optimism about future living standards is highest among younger Americans, and tends to decrease as age increases. Standard-of-living optimism has increased slightly among younger Americans but is largely unchanged across other age groups over the past year.

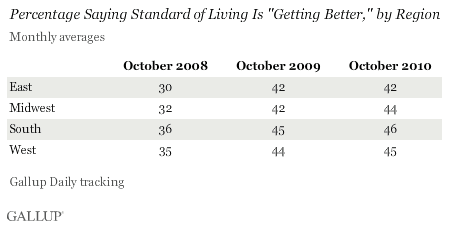
The percentage of Americans saying their standard of living is getting better is essentially unchanged across all regions of the country during the past year. Americans are slightly more optimistic about their future standard of living in the South and the West than they are in the East.

Americans' Personal Balance Sheets Need Healing
Regardless of income, age, or region, Americans are much more optimistic about their future standard of living now than they were two years ago in October 2008, as the financial crisis was getting underway. However, standard-of-living optimism has not improved since October 2009. This lack of improvement may explain, at least in part, why many Americans continue to spend at the "new normal" level of a year ago and so much less than they did during the recession year of 2008. It may also relate to why they expressed so much displeasure with the Congress during the midterm elections.
What Americans need most right now is to rebuild their personal balance sheets -- reducing their debt while building their assets. Once they get more comfortable with their personal financial situations, they are likely to feel better about spending and become more optimistic about their future standard of living. Gallup data show 51% of Americans feeling better about their financial situation these days -- essentially the same as the percentage of Americans optimistic about their future standard of living.
In this regard, it appears the Federal Reserve is trying to create some optimism by injecting added liquidity into the financial system. Based on Wall Street's reaction since the Fed meeting this week, the Fed's efforts are working to create new wealth for many investors. Whether and to what degree the gains on Wall Street will translate into more optimism on the part of average Americans about their future living standards is not so clear.
Gallup.com reports results from these indexes in daily, weekly, and monthly averages and in Gallup.com stories. Complete trend data are always available to view and export in the following charts:
Daily: Employment, Economic Confidence and Job Creation, Consumer Spending
Weekly: Employment, Economic Confidence, Job Creation, Consumer Spending
Read more about Gallup's economic measures.
Survey Methods
Results are based on telephone interviews conducted as part of Gallup Daily tracking Oct. 1-31, 2010, with a random sample of 30,267 adults, aged 18 and older, living in all 50 U.S. states and the District of Columbia, selected using random-digit-dial sampling.
For results based on the total sample of national adults, one can say with 95% confidence that the maximum margin of sampling error is ±1 percentage point.
Interviews are conducted with respondents on landline telephones and cellular phones, with interviews conducted in Spanish for respondents who are primarily Spanish-speaking. Each daily sample includes a minimum quota of 150 cell phone respondents and 850 landline respondents, with additional minimum quotas among landline respondents for gender within region. Landline respondents are chosen at random within each household on the basis of which member had the most recent birthday.
Samples are weighted by gender, age, race, Hispanic ethnicity, education, region, adults in the household, cell phone-only status, cell phone-mostly status, and phone lines. Demographic weighting targets are based on the March 2009 Current Population Survey figures for the aged 18 and older non-institutionalized population living in U.S. telephone households. All reported margins of sampling error include the computed design effects for weighting and sample design.
In addition to sampling error, question wording and practical difficulties in conducting surveys can introduce error or bias into the findings of public opinion polls.
For more details on Gallup's polling methodology, visit www.gallup.com.
