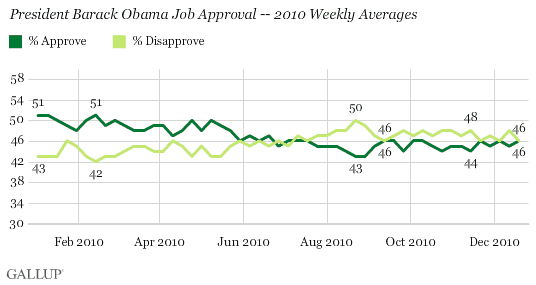
PRINCETON, NJ -- President Barack Obama's approval rating held steady in the mid-40s during the week ending Dec. 19, his 100th week in office and the week he signed the Bush tax-cut extension into law. Obama's average 46% approval rating for the week is similar to his 45% approval rating the previous week, and is within the 44% to 46% range seen since September.

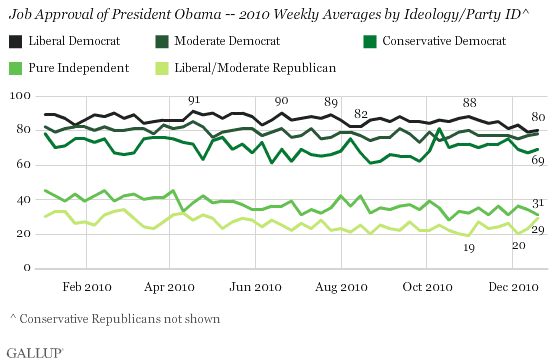
Liberal Democrats' approval of Obama remained subdued, averaging 80% in the past week, similar to the 79% in the previous week and below the 88% found just prior to the midterm elections. This is based on Democrats as well as independents who lean Democratic.
Obama's approval from liberal Democrats is now on par with that from moderate Democrats (78%), although still higher than conservative Democrats' approval (69%).
In contrast, Obama's approval rating among moderate/liberal Republicans (including independents who lean Republican) has increased in December, rising from 20% to 29% in just the past two weeks. This is his highest level of support from moderate/liberal Republicans since May.

At 9%, conservative Republicans' approval of Obama has not changed appreciably, varying between 5% and 10% since June. Approval of Obama has also held fairly steady in recent weeks among other demographic groups, including by gender, age, race/ethnicity, and household income.
Bottom Line
While the tax deal hammered out between President Obama and Republican leaders created a political stir in Washington, the matter has had little effect on Americans' overall approval of Obama. He has lost some support from liberal Democrats in recent weeks, but much of that decline occurred in the first few weeks after the elections, and before the tax deal. Since the tax deal, he has gained some from moderate/liberal Republicans; however, given that these groups represent just a third of all Republicans, their effect on the president's overall approval rating has been fairly minimal. The net result of all these changes is that Obama's approval rating has remained fairly steady since the elections -- which, as Gallup has noted, is unusual for a president whose party suffered big midterm losses.
Survey Methods
Results are based on telephone interviews conducted as part of Gallup Daily tracking Dec. 13-19, 2010, with a random sample of 3,560 adults, aged 18 and older, living in all 50 U.S. states and the District of Columbia, selected using random-digit-dial sampling.
For results based on the total sample of national adults, one can say with 95% confidence that the maximum margin of sampling error is ±2 percentage points.
Interviews are conducted with respondents on landline telephones and cellular phones, with interviews conducted in Spanish for respondents who are primarily Spanish-speaking. Each daily sample includes a minimum quota of 150 cell phone respondents and 850 landline respondents, with additional minimum quotas among landline respondents for gender within region. Landline respondents are chosen at random within each household on the basis of which member had the most recent birthday.
Samples are weighted by gender, age, race, Hispanic ethnicity, education, region, adults in the household, cell phone-only status, cell phone-mostly status, and phone lines. Demographic weighting targets are based on the March 2009 Current Population Survey figures for the aged 18 and older non-institutionalized population living in U.S. telephone households. All reported margins of sampling error include the computed design effects for weighting and sample design.
In addition to sampling error, question wording and practical difficulties in conducting surveys can introduce error or bias into the findings of public opinion polls.
For more details on Gallup's polling methodology, visit www.gallup.com.
