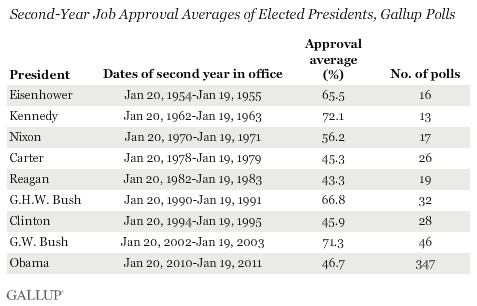
PRINCETON, NJ -- Barack Obama averaged 46.7% job approval in his second full year in office, spanning Jan. 20, 2010-Jan. 19, 2011. That places Obama's approval on the low end compared with other presidents elected to office since World War II -- similar to the averages of Jimmy Carter and Bill Clinton, but better than Ronald Reagan's historical low second-year average.

Obama's low second-year ratings are due in large part to the struggles of the U.S. economy. The other presidents with low second-year averages also took office during difficult economic times. With a Democratic congressional majority, Obama was able to achieve much legislatively, most notably the landmark, though not altogether popular, healthcare legislation passed in March 2010.
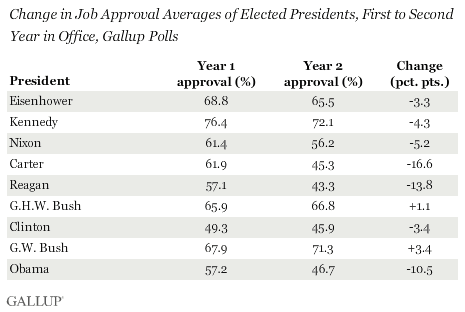
From his first to his second year in office, Obama's average approval rating fell 10.5 percentage points, one of the largest first- to second-year drops Gallup has measured. Only Carter and Reagan had larger drops among elected presidents.

Among all post-World War II presidents, Harry Truman had the largest drop, 37.8 points, from his first to second year in office. His 79.3% first-year average in 1945 was boosted by the rally in public support after Franklin Roosevelt's death and the United States' defeat of the Germans and Japanese in World War II.
George H.W. Bush and George W. Bush are the only presidents whose average approval ratings did not decline from their first to second years in office; they benefited from rallies in public support due to international crises (Iraq's invasion of Kuwait in 1990 and the Sept. 11 terrorist attacks in 2001).
Slight Improvement in Obama's Latest Quarterly Average
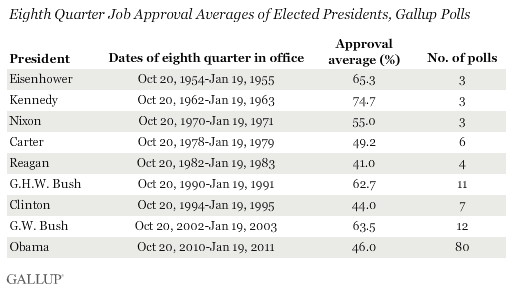
The end of Obama's second year in office also marks the end of his eighth quarter as president, which began Oct. 20, during which Obama averaged 46.0% job approval. That is also on the low end compared with other elected presidents, better than only Clinton's and Reagan's eighth quarter averages.

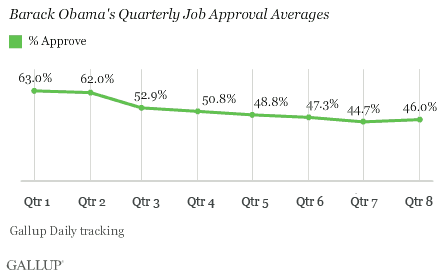
However, the eighth quarter did bring some encouraging signs for Obama. Though his 46.0% quarterly average is still low in an absolute sense, this marks the first time his approval rating has improved from one quarter to the next, although by a modest 1.3 points.

Obama's more recent numbers have been even more positive, hovering around 50%. In fact, Obama ends his second year and eighth quarter in office with a 51% job approval rating in the latest Gallup Daily three-day rolling average, his best since May.
The reason for the recent improvement is unclear, though it could be due to his response to the Tucson, Ariz., shootings, or the flurry of legislative activity at the end of last year's lame-duck session of Congress.
Implications
Although President Obama accomplished a lot during his second year in office, it was a challenging year for him politically. His approval ratings generally held below the majority level, and were arguably a major reason his party suffered heavy losses during the midterm elections in November. He begins his third year in office on a bit of an upswing, hoping for continued improvement in his public support.
There is no clear pattern of change in presidents' approval ratings between their second and third year; about as many improved (Truman, Eisenhower, Gerald Ford, Reagan, the elder Bush, and Clinton) as got worse (John Kennedy, Lyndon Johnson, Richard Nixon, Carter, the younger Bush).
Improvement in Obama's third year could be a key sign of his re-election prospects. Of the three presidents whose ratings are most similar to his at the same point in their presidencies, the two whose ratings improved their third year (Reagan and Clinton) were re-elected the following year, and the one whose ratings continued to decline (Carter) was defeated.
Explore Obama's approval ratings in depth and compare them with those of past presidents in the Gallup Presidential Job Approval Center.
Survey Methods
Results are based on telephone interviews conducted as part of Gallup Daily tracking Oct. 20, 2010-Jan. 19, 2011, with a random sample of 82,710 adults, aged 18 and older, living in all 50 U.S. states and the District of Columbia, selected using random-digit-dial sampling.
For results based on the total sample of national adults, one can say with 95% confidence that the maximum margin of sampling error is ±1 percentage point.
Interviews are conducted with respondents on landline telephones and cellular phones, with interviews conducted in Spanish for respondents who are primarily Spanish-speaking. Each daily sample includes a minimum quota of 200 cell phone respondents and 800 landline respondents, with additional minimum quotas among landline respondents for gender within region. Landline respondents are chosen at random within each household on the basis of which member had the most recent birthday.
Samples are weighted by gender, age, race, Hispanic ethnicity, education, region, adults in the household, cell phone-only status, cell phone-mostly status, and phone lines. Demographic weighting targets are based on the March 2010 Current Population Survey figures for the aged 18 and older non-institutionalized population living in U.S. telephone households. All reported margins of sampling error include the computed design effects for weighting and sample design.
In addition to sampling error, question wording and practical difficulties in conducting surveys can introduce error or bias into the findings of public opinion polls.
For more details on Gallup's polling methodology, visit www.gallup.com.
