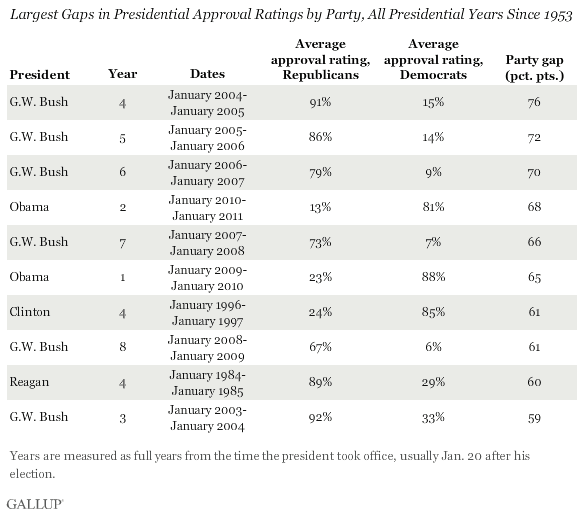
PRINCETON, NJ -- President Barack Obama's job approval ratings were even more polarized during his second year in office than during his first, when he registered the most polarized ratings for a first-year president. An average of 81% of Democrats and 13% of Republicans approved of the job Obama was doing as president during his second year. That 68-point gap in party ratings is up from 65 points in his first year and is easily the most polarized second year for a president since Dwight Eisenhower.

Ronald Reagan and Bill Clinton are the only two presidents prior to Obama who had gaps of at least 50 points in their approval ratings by party in their second year in office. In general, recent presidents, including George W. Bush, tend to have more polarized ratings than earlier presidents did.
Though Obama's first- and second-year ratings rank among the most polarized of all presidential years, Bush had three years with a larger gap in party ratings. In Bush's fourth year in office -- the year he was re-elected -- there was an average 76-point gap in approval ratings of him between Republicans and Democrats.

In total, Bush accounts for 6 of the 10 most polarized presidential years in Gallup history. Bush's first two years were less polarized owing to the rally in support he got from Americans after the Sept. 11, 2001, terrorist attacks.
Clinton and Reagan are the only other presidents to make the top 10 list; both did so in the year they were re-elected.
Implications
Though Americans have always been more approving of presidents from the party they support than of presidents from the party they oppose, the partisan gap in presidential ratings has expanded. As Gallup pointed out last year, none of the presidents prior to Reagan averaged more than a 40-point gap in approval ratings by party. But from Reagan through Obama, all except George H.W. Bush have averaged more than a 50-point divide in party ratings.
The growing polarization is made clear by the fact that each of the last eight years -- spanning the final six years of George W. Bush's administration and the first two of Obama's -- have ranked in the 10 most polarized years in presidential approval ratings since 1953.
Obama has made efforts of late to work with congressional Republicans, such as on the deal to extend the Bush-era income tax cuts. These efforts may have helped fuel a rise in his approval ratings, from 44% in mid-November to 50% in the most recent weekly average. But the rise in Obama's public support has not necessarily meant a reduction in the polarization of views about him, as there continues to be a nearly 70-point gap between Democratic and Republican approval ratings of the president.
Survey Methods
Results are based on telephone interviews conducted as part of Gallup Daily tracking Jan. 20, 2010-Jan. 19, 2011, with a random sample of 178,864 adults, aged 18 and older, living in all 50 U.S. states and the District of Columbia, selected using random-digit-dial sampling.
For results based on the total sample of national adults, one can say with 95% confidence that the maximum margin of sampling error is ±1 percentage point.
For results based on the total sample of 56,106 Democrats, one can say with 95% confidence that the maximum margin of sampling error is ±1 percentage point.
For results based on the total sample of 54,593 Republicans, one can say with 95% confidence that the maximum margin of sampling error is ±1 percentage point.
Interviews are conducted with respondents on landline telephones and cellular phones, with interviews conducted in Spanish for respondents who are primarily Spanish-speaking. Each daily sample includes a minimum quota of 200 cell phone respondents and 800 landline respondents, with additional minimum quotas among landline respondents for gender within region. Landline respondents are chosen at random within each household on the basis of which member had the most recent birthday.
Samples are weighted by gender, age, race, Hispanic ethnicity, education, region, adults in the household, cell phone-only status, cell phone-mostly status, and phone lines. Demographic weighting targets are based on the March 2010 Current Population Survey figures for the aged 18 and older non-institutionalized population living in U.S. telephone households. All reported margins of sampling error include the computed design effects for weighting and sample design.
In addition to sampling error, question wording and practical difficulties in conducting surveys can introduce error or bias into the findings of public opinion polls.
For more details on Gallup's polling methodology, visit www.gallup.com.
