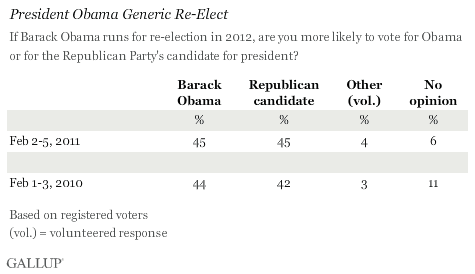
PRINCETON, NJ -- U.S. registered voters are evenly split about whether they would back President Barack Obama for re-election in 2012 (45%) or "the Republican Party's candidate" (45%). This is similar to the results for the same question when it was asked a year ago.

Results from a parallel question Gallup asked during the presidencies of George W. Bush and George H.W. Bush show both of those presidents performing better on this re-elect measure at comparable points in their third years in office than Obama does today.
In polling from October 2001 through January 2004, George W. Bush consistently led an unnamed Democratic opponent, although by a shrinking margin as his job approval rating descended from a post-9/11 reading of 87% to the 50s and 60s. In February 2003, the point in Bush's presidency comparable to Obama's presidency today, Bush beat a generic Democrat among registered voters by 47% to 39%.
Gallup trends during George H.W. Bush's tenure were asked mostly during his third year in office, and show a similar descent in the elder Bush's standing vis-à-vis an unnamed Democrat. However, Bush's position switched from a strong lead -- 54% to 33% -- in February 1991, during the Persian Gulf War, to a slight deficit (39% to 43%) in early January 1992.
Most 2008 Demographic Support Patterns Carry Over to 2012
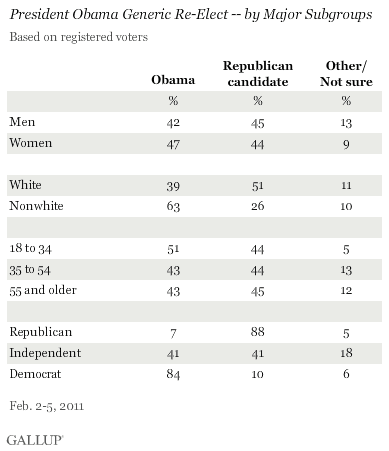
Women and nonwhites were important elements of Obama's winning 2008 coalition. Today, a wide gulf in political preferences remains between whites and nonwhites, with the majority of the former favoring the Republican candidate and a larger majority of the latter favoring Obama. Women are five percentage points more likely to say they would vote for Obama than are men (47% vs. 42%), similar to the seven-point gender gap in support for Obama in Gallup's final pre-election poll in 2008.
Younger voters are one element of Obama's original coalition that may not be intact heading into 2012. Gallup's 2008 pre-election poll found 63% of registered voters aged 18 to 34 choosing Obama, while 33% backed his Republican rival, John McCain. In addition, 53% of 35- to 54-year-old voters and 48% of those 55 and older supported Obama in that same poll. By contrast, today a bare majority of the 18- to 34-year-old group, 51%, and 43% of those 35 to 54 say they would vote to re-elect Obama.
Naturally, a large proportion of Democrats, 84%, support Obama for re-election, similar to the 88% of Republicans backing the Republican candidate.

Bottom Line
It's a political maxim that in elections with a sitting president running for re-election, voters are not so much choosing between two candidates as voting for or against the incumbent. That is not to say it won't matter whom the Republicans choose as their standard-bearer, but perhaps it matters slightly less than it would in an open election.
At this stage, as numerous Republican contenders begin the long process of wooing Republican delegates and voters, or consider jumping into the race, Gallup's generic re-elect measure indicates that their efforts would not be in vain, as fewer than half of registered voters are prepared to vote for Obama in 2012. Both George W. Bush and George H.W. Bush were better positioned for re-election at this point in their presidencies. However, given that one ultimately won and the other lost his re-election bid, it is clear that much can still change.
Survey Methods
Results for this Gallup poll are based on telephone interviews conducted Feb. 2-5, 2011, with a random sample of 1,015 adults, aged 18 and older, living in the continental U.S., selected using random-digit-dial sampling.
For results based on the total sample of national adults, one can say with 95% confidence that the maximum margin of sampling error is ±4 percentage points.
For results based on the total sample of registered voters, one can say with 95% confidence that the maximum margin of sampling error is ±4 percentage points.
Interviews are conducted with respondents on landline telephones (for respondents with a landline telephone) and cellular phones (for respondents who are cell phone-only). Each sample includes a minimum quota of 150 cell phone-only respondents and 850 landline respondents, with additional minimum quotas among landline respondents for gender within region. Landline respondents are chosen at random within each household on the basis of which member had the most recent birthday.
Samples are weighted by gender, age, race, education, region, and phone lines. Demographic weighting targets are based on the March 2010 Current Population Survey figures for the aged 18 and older non-institutionalized population living in continental U.S. telephone households. All reported margins of sampling error include the computed design effects for weighting and sample design.
In addition to sampling error, question wording and practical difficulties in conducting surveys can introduce error or bias into the findings of public opinion polls.
View methodology, full question results, and trend data.
For more details on Gallup's polling methodology, visit www.gallup.com.
