PRINCETON, NJ -- Americans' optimism about the future direction of the U.S. economy plunged in March for the second month in a row, as the percentage of Americans saying the economy is "getting better" fell to 33% -- down from 41% in January. It is also down three points from the 36% of March 2010.
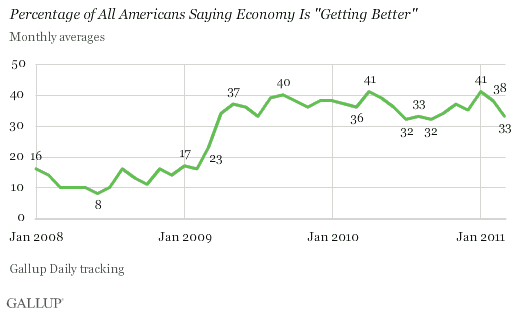
Optimism in March essentially matches last year's low points: 32% in July, 33% in August, and 32% in September. However, it remains higher than it was throughout 2008 and early 2009.
Economic Optimism Declines Across Demographic Groups
While upper-income Americans remain more optimistic than their lower- and middle-income counterparts, optimism among both groups declined substantially in March. Despite Wall Street's strong first quarter performance, the percentage of upper-income Americans saying the economy is getting better fell to 41% in March from 50% in January, leaving it at the same level as a year ago. Lower- and middle-income Americans' economic optimism also fell in March, to 32%, from 40% in January.
Optimism about the future of the economy declined across all political parties during the first quarter. Democrats remain the most optimistic, with 45% saying things are getting better, but this is down from 55% in January and 52% a year ago. Independents' economic optimism is at 31% and Republicans' at 21% -- both down from January.
Men continue to be more optimistic than women in their expectations for the economy, but both genders are less optimistic now than in January and compared with March 2010.
Americans of all ages also became less optimistic about the economy in March. Young adults continue to be much more optimistic, however, than do older Americans.
Gallup's Economic Confidence Index Also Takes a Plunge in March
Gallup's Economic Confidence Index, which includes the economic optimism measure, also plunged in March to -31. This is worse than the -21 in January and about the same as the -30 of a year ago.
The Index is based on two questions, which measure Americans' views of current economic conditions and their future expectations. The sharp decline in the latter brought down the index score in the first quarter of the year. Americans' perceptions of current economic conditions are not much different in March -- with 44% rating the economy "poor" -- than they were in January, when 42% said the same.
Implications
Even as economic adversity seems to mount, the U.S. commodity and equity markets remain near their highs for the year. Surging oil and commodity prices mean higher profits for many companies and investors. Further, a weak U.S. economy suggests the Federal Reserve will continue its easing policies despite some tightening in Europe. While the weakening of the global economy may not be good for U.S. exports, the declining U.S. dollar may moderate the negative impact on many U.S. exporters and their stock values.
On the other hand, American consumers face several major challenges. Soaring gas and food prices not only reduce disposable income but also discourage additional spending as the cost of necessities increases. Global events, continued political battles about the budget in the nation's capital, and a weak, if modestly improving job market add to consumer uncertainties. As a result, it is not surprising that consumer confidence plummets even as Wall Street continues to do well.
However, if consumers continue to lack confidence and spending doesn't increase, it is hard to see how the U.S. economy can continue its modest improvement. In turn, it would seem Wall Street and Main Street will have to align at some point going forward. Either Wall Street will prove right and economic conditions on Main Street will improve or the reverse will prove to be the case.
Gallup.com reports results from these indexes in daily, weekly, and monthly averages and in Gallup.com stories. Complete trend data are always available to view and export in the following charts:
Daily: Employment, Economic Confidence and Job Creation, Consumer Spending
Weekly: Employment, Economic Confidence, Job Creation, Consumer Spending
Read more about Gallup's economic measures.
View our economic release schedule.
Survey Methods
Results are based on telephone interviews conducted as part of Gallup Daily tracking during March 2011 with 15,561 respondents, aged 18 and older, living in all 50 U.S. states and the District of Columbia, selected using random-digit-dial sampling.
For results based on the total monthly sample of national adults, one can say with 95% confidence that the maximum margin of sampling error is ±1 percentage point.
Interviews are conducted with respondents on landline telephones and cellular phones, with interviews conducted in Spanish for respondents who are primarily Spanish-speaking. Each daily sample includes a minimum quota of 200 cell phone respondents and 800 landline respondents, with additional minimum quotas among landline respondents for gender within region. Landline respondents are chosen at random within each household on the basis of which member had the most recent birthday.
Samples are weighted by gender, age, race, Hispanic ethnicity, education, region, adults in the household, cell phone-only status, cell phone-mostly status, and phone lines. Demographic weighting targets are based on the March 2010 Current Population Survey figures for the aged 18 and older non-institutionalized population living in U.S. telephone households. All reported margins of sampling error include the computed design effects for weighting and sample design.
In addition to sampling error, question wording and practical difficulties in conducting surveys can introduce error or bias into the findings of public opinion polls.
For more details on Gallup's polling methodology, visit www.gallup.com.
