PRINCETON, NJ -- Half of Americans believe the amount they pay in federal income taxes is too high, while 43% consider it about right and 4% too low. The 50% now calling their taxes "too high" is within the 46% to 53% range found each year since 2003. It is significantly lower than the 65% recorded in 2001, prior to implementation of former President George W. Bush's first round of federal tax cuts.
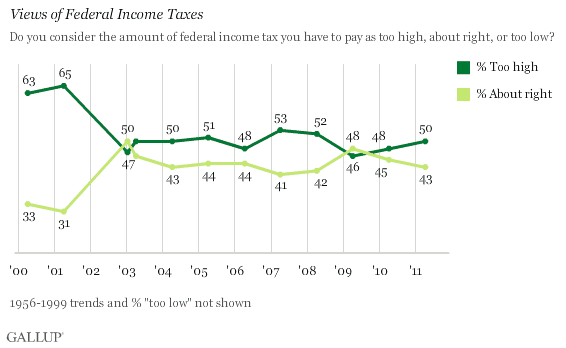
The new findings are from Gallup's annual Economy and Personal Finance poll, conducted April 7-11.
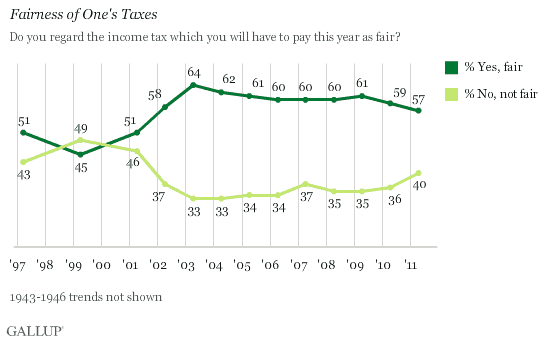
The same poll finds 57% of Americans characterizing what they pay in income taxes as "fair" and 40% as not fair. Notably, more Americans consider their taxes fair than say they pay the right amount in taxes (57% vs. 43%), suggesting more people dislike what they pay than feel it is unjust.
While the majority remain positive about the fairness of their own taxes, the margin has narrowed slightly over the past three years.
Few Sympathize With Upper-Income Americans, Corporations on Taxes
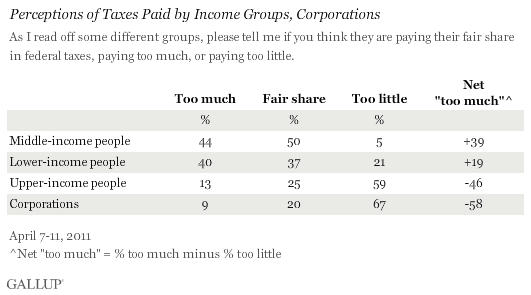
Americans have very different views about the fairness of taxes paid by three broad income categories of Americans, plus corporations, with results virtually unchanged from 2010.
Middle-income earners are perceived as the most aggrieved taxpayers: 44% of Americans say they pay too much, while only 5% say they pay too little and 50% say they pay "their fair share." By contrast, 13% of Americans say upper-income people pay too much and 59% believe they pay too little. Views about lower-income people are the most mixed, with 40% saying they pay too much vs. 21% too little and 37% their fair share. On the subject of taxes, Americans are the least sympathetic to corporations, with 67% saying they pay too little and only 9% too much.
Wealthy Americans Feel the Most Burdened by Taxes
In a recent speech outlining his vision for reducing the national debt, President Barack Obama repeated his call for repealing the Bush-era tax breaks on couples earning at least $250,000 a year. In doing so, he stated that the majority of wealthy Americans would agree that they should pay more.
Not so, according to a compilation of Gallup data from the last several years.
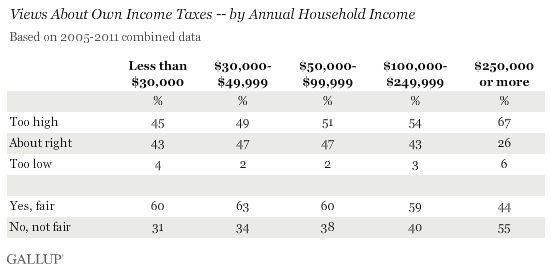
Adults in households earning $250,000 or more typically make up less than 3% of respondents in Gallup national surveys, too few for a single poll to report on. However, across the seven annual Gallup Economy & Personal Finance surveys since 2005, all of which were conducted after President Bush's 2003 tax cuts took effect, Gallup interviewed 170 adults living in households earning $250,000 or more.
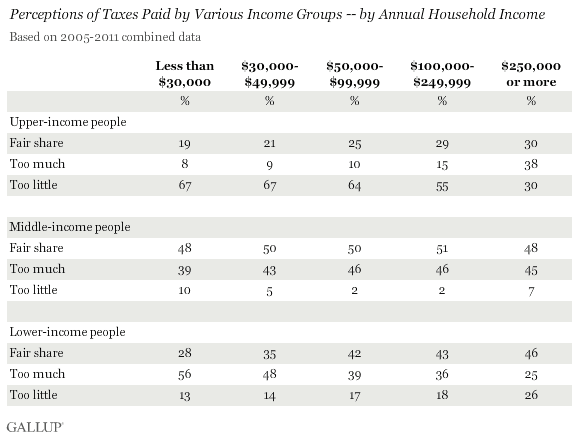
According to the combined 2005-2011 data, Americans earning at least a quarter of a million dollars are the most likely of five income groups to believe their federal income taxes are too high (67%) and the least likely to say they are fair. In fact, they are the only income group more likely to say their taxes are not fair than fair, 55% vs. 44%.
Additionally, 68% of high-income Americans believe "upper-income people" pay either their fair share or too much in federal taxes (30% and 38%, respectively), while 30% say they pay too little. This is starkly different from the views of all groups making less than $250,000, the majority of whom say upper-income people pay too little.
Views about the taxes middle-income Americans pay are relatively similar across income groups: most groups are evenly divided between saying middle-income Americans pay too much and saying they pay their fair share.
All groups think lower-income Americans pay either too much or the right amount in taxes. However, the percentage specifically saying they pay too much declines from 56% of low-income Americans to 25% of high-income Americans.
Bottom Line
Despite much recent debate in Washington, D.C., about taxes and whether they should be cut or raised to help address the nation's deficit and sluggish economy, Americans' views about federal income taxes today are similar to their views a year ago, perhaps reflecting stability in the tax code over that time. About half of Americans continue to believe their own taxes are too high, while the slight majority consider their tax bill fair.
Of all major income groups, those making upward of a quarter million per year feel the most burdened by federal income taxes. One possible cause is that, depending on their deductions, those meeting this income threshold could fall into either the 33% or 35% federal income tax bracket, compared with the 15% tax bracket associated with the median U.S. household income of roughly $50,000.
Nevertheless, given Americans' broad perception that the wealthy pay too little, it is not surprising that a recent Gallup poll found 59% in favor of higher taxes on those making $250,000 or above, in line with President Obama's proposal. Raising taxes on the middle class would be far riskier politically, as large majorities of all income groups agree that middle-income earners already pay their fair share or pay too much.
Survey Methods
Results for the latest Gallup poll are based on telephone interviews conducted April 7-11, 2011, with a random sample of 1,077 adults, aged 18 and older, living in the continental U.S., selected using random-selection methods.
For results based on the total sample of national adults, one can say with 95% confidence that the maximum margin of sampling error is ±4 percentage points.
Aggregated data are based on Gallup's 2005 through 2011 Economy and Personal Finances survey, conducted each April. Sample sizes and associated margins of sampling error for each household income category are as follows:
2011 Interviews are conducted with respondents on landline telephones and cellular phones, with interviews conducted in Spanish for respondents who are primarily Spanish-speaking. Each sample includes a minimum quota of 400 cell phone respondents and 600 landline respondents, with additional minimum quotas among landline respondents for gender within region. Landline numbers are chosen at random among listed telephone numbers, cell phone numbers are selected using random-digit dial methods. Landline respondents are chosen at random within each household on the basis of which member had the most recent birthday.
Samples are weighted by gender, age, race, Hispanic ethnicity, education, region, adults in the household, and phone status (cell phone only/landline only/both, having an unlisted landline number, and being cell phone mostly). Demographic weighting targets are based on the March 2010 Current Population Survey figures for the age 18+ non-institutionalized population living in U.S. telephone households. All reported margins of sampling error include the computed design effects for weighting and sample design.
In addition to sampling error, question wording and practical difficulties in conducting surveys can introduce error or bias into the findings of public opinion polls.
View methodology, full question results, and trend data.
For more details on Gallup's polling methodology, visit www.gallup.com.
