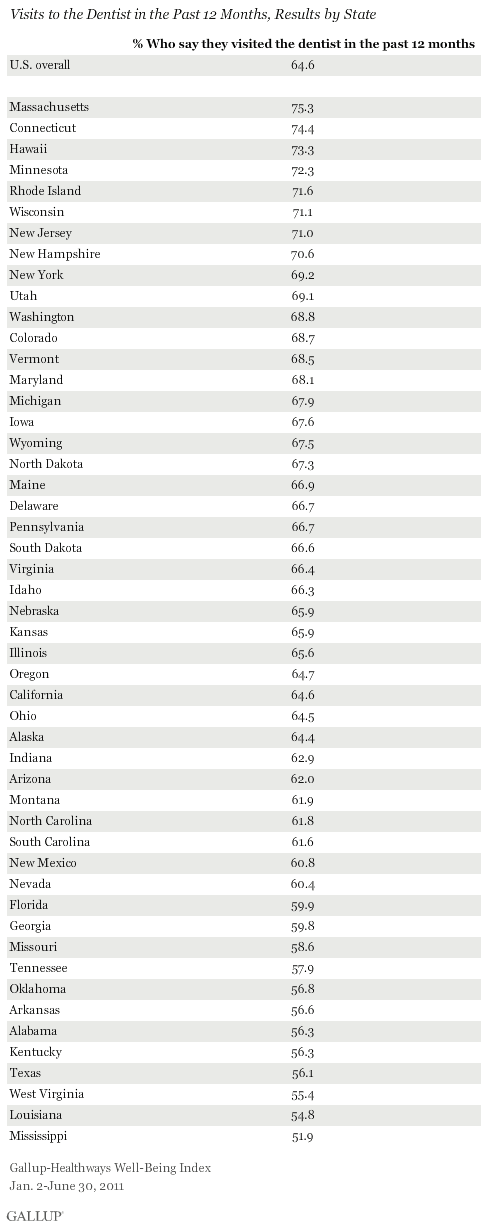
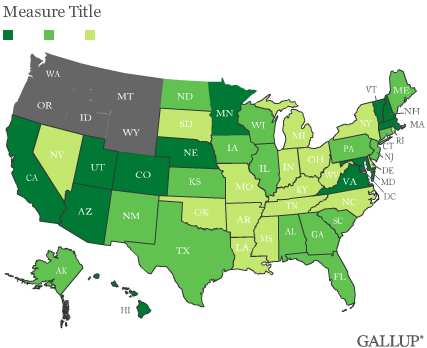
WASHINGTON, D.C. -- Three in four Massachusetts residents say they visited a dentist in the last 12 months, a higher rate than in any other state in the nation. Those living in Mississippi were least likely to say they go to the dentist, followed by Louisiana and West Virginia residents.
These state-level data, collected as part of the Gallup-Healthways Well-Being Index, are from January through June 2011 and encompass more than 177,000 interviews conducted among national adults, aged 18 and older. Nationwide, an average of 65% of all American adults say they visited a dentist in the last 12 months during this time period, essentially unchanged from past years.
See page 2 for all incidence of dentist visits for all states.
Regionally, people living in states in the Northeast and upper Midwest are the most likely to say they visited the dentist in the past 12 months. Southern states, on the other hand, have the lowest percentages of people who say they visited the dentist. The nine states with the lowest incidence of dentist visits are in the South.
Health Insurance, Dentist Visits Linked
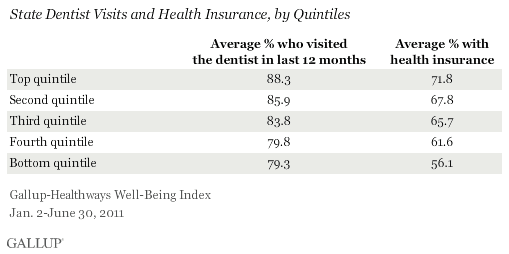
Health insurance appears to play a role in whether Americans go to the dentist. States where residents are the most likely to visit the dentist also have some of the lowest uninsured rates in the nation. The top 10 states for dental visits, for example, have an average health insurance rate of nearly 72%. This compares with an average of 56% in the bottom 10 states.
Implications
Poor oral care can lead to many potential negative health outcomes. When combined with other risk factors, poor oral health can be linked to heart disease, stroke, atherosclerosis, rheumatoid arthritis, and diabetes, among others. Maternal periodontal disease, too, has been linked to preterm births.
The range in good oral health behaviors across the 50 states is considerable and may be indicative of several factors, including household income. Having health insurance coverage -- which is related to income -- also appears to be a critical factor in dental visits. However, it should be noted that the Well-Being Index only confirms whether a respondent has health insurance, not dental insurance. Based on the Well-Being Index data, a 10-percentage-point increase in the percentage of Americans with health insurance could mean as much as a 6-point increase in the percentage who visit the dentist each year, with a potentially considerable positive effect on many of the negative health outcomes associated with poor oral health.
This story is part of a series of midyear updates on Gallup's State of the States data. Gallup.com will report new full-year totals in early 2012 based on all 2011 surveys.
About the Gallup-Healthways Well-Being Index
The Gallup-Healthways Well-Being Index tracks U.S. and U.K. well-being and provides best-in-class solutions for a healthier world. To learn more, please visit well-beingindex.com.
Survey Methods
Results are based on telephone interviews conducted as part of the Gallup-Healthways Well-Being Index survey Jan. 2-June 30, 2011, with a random sample of 177,237 adults, aged 18 and older, living in all 50 U.S. states and the District of Columbia, selected using random-digit-dial sampling.
For results based on the total sample of national adults, one can say with 95% confidence that the maximum margin of sampling error is ±0.2 percentage points. The margin of sampling error for most states is ±1-2 percentage points, but as high as ±4 points for smaller states such as Wyoming, North Dakota, South Dakota, Nebraska, and Hawaii.
The Gallup-Healthways Well-Being Index categorizes the District of Columbia as a congressional district.
Interviews are conducted with respondents on landline telephones and cellular phones, with interviews conducted in Spanish for respondents who are primarily Spanish-speaking. Each sample includes a minimum quota of 400 cell phone respondents and 600 landline respondents per 1,000 national adults, with additional minimum quotas among landline respondents by region. Landline telephone numbers are chosen at random among listed telephone numbers. Cell phone numbers are selected using random-digit-dial methods. Landline respondents are chosen at random within each household on the basis of which member had the most recent birthday.
Samples are weighted by gender, age, race, Hispanic ethnicity, education, region, adults in the household, and phone status (cell phone only/landline only/both, cell phone mostly, and having an unlisted landline number). Demographic weighting targets are based on the March 2010 Current Population Survey figures for the aged 18 and older non-institutionalized population living in U.S. telephone households. All reported margins of sampling error include the computed design effects for weighting and sample design.
In addition to sampling error, question wording and practical difficulties in conducting surveys can introduce error or bias into the findings of public opinion polls.
For more details on Gallup's polling methodology, visit https://www.gallup.com/.
