This story is part of an ongoing series on Gallup.com on Americans' views on the role and performance of government.
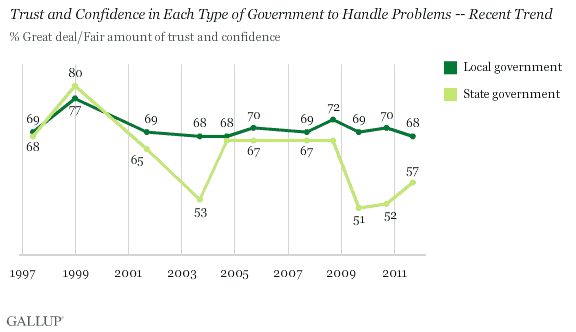
PRINCETON, NJ -- Two-thirds of Americans have a great deal or fair amount of confidence in their local governments to handle local problems, and a solid majority feel the same way about their state government.

Confidence in state government matched confidence in local government as recently as 2008; however, the former fell sharply in 2009 as statehouses across the country began to grapple with major budgetary problems, and it has yet to fully recover.
Still, Americans remain more confident in state and local government than in the two policymaking branches of the federal government, according to findings from the Sept. 8-11 update of Gallup's annual Governance poll.
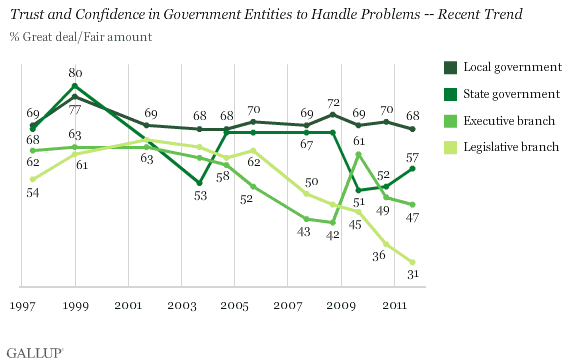
Currently, less than a third of Americans have solid confidence in the legislative branch, with just 5% saying they have a great deal of confidence in it. Overall confidence in the executive branch is also muted, at 47%.

Americans' persistent high confidence in local government contrasts with their generally diminishing confidence in the legislative and executive branches over the past five or so years.
Confidence in the executive branch fell annually during George W. Bush's presidency from 2002 through 2008; it then surged in 2009 after President Barack Obama took office, but has since declined.
Juxtaposing all four trend lines makes it clear that local government has fared particularly well over time, being the only governmental entity not to have lost any of Americans' trust since 1997. Trust in state government is now 11 percentage points lower than in 1997, while trust in the executive and legislative branches is down by 15 points or more.

Southerners and Easterners Give States Highest Ratings
Residents of the South and East currently express the most confidence in their state governments and those in the Midwest and West, the least. Over the past decade, Gallup has generally found Southern residents on the upper end of trust in state government and Western residents on the lower end.

With the two major political parties broadly sharing control of the nation's statehouses and governors' mansions, national ratings of state government are far less partisan than are ratings of the legislative and executive branches of the federal government. Majorities of Republicans (60%), independents (59%), and Democrats (52%) say they have a great deal or fair amount of confidence in their state government.
Bottom Line
Americans' confidence in local government remains high, as it has for more than a decade, amid plummeting ratings for the presidency and Congress, and occasional downturns in ratings of state governments. Currently, both local and state governments receive more public trust than does either the executive or the legislative branch. More broadly, recent Gallup polling shows Americans' faith in several aspects of the federal government at historical lows.
State and local governments cannot perform many of the policy roles for which the federal government is responsible. Yet state and local officials could find that the public trust they enjoy would provide them strong public support for taking more control from Washington of the areas they are already involved in, such as education, health and human services, transportation, environmental regulations, and crime control.
Survey Methods
Results for this Gallup poll are based on telephone interviews conducted Sept. 8-11, 2011, with a random sample of 1,017 adults, aged 18 and older, living in all 50 U.S. states and the District of Columbia.
For results based on the total sample of national adults, one can say with 95% confidence that the maximum margin of sampling error is ±4 percentage points.
Interviews are conducted with respondents on landline telephones and cellular phones, with interviews conducted in Spanish for respondents who are primarily Spanish-speaking. Each sample includes a minimum quota of 400 cell phone respondents and 600 landline respondents per 1,000 national adults, with additional minimum quotas among landline respondents by region. Landline telephone numbers are chosen at random among listed telephone numbers. Cell phone numbers are selected using random-digit-dial methods. Landline respondents are chosen at random within each household on the basis of which member had the most recent birthday.
Samples are weighted by gender, age, race, Hispanic ethnicity, education, region, adults in the household, and phone status (cell phone only/landline only/both, cell phone mostly, and having an unlisted landline number). Demographic weighting targets are based on the March 2010 Current Population Survey figures for the aged 18 and older non-institutionalized population living in U.S. telephone households. All reported margins of sampling error include the computed design effects for weighting and sample design.
In addition to sampling error, question wording and practical difficulties in conducting surveys can introduce error or bias into the findings of public opinion polls.
View methodology, full question results, and trend data.
For more details on Gallup's polling methodology, visit www.gallup.com.
