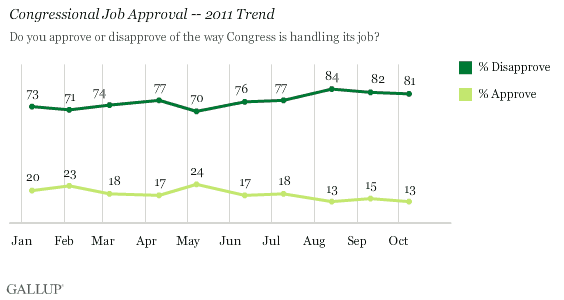
PRINCETON, NJ -- The percentage of Americans who approve of the job Congress is doing returned to 13% in October, matching the all-time Gallup low on this measure, first recorded in December 2010 and repeated in August.

Congress' approval has been low all year, registering below 20% each month since June. The latest results are based on a Gallup poll conducted Oct. 6-9.
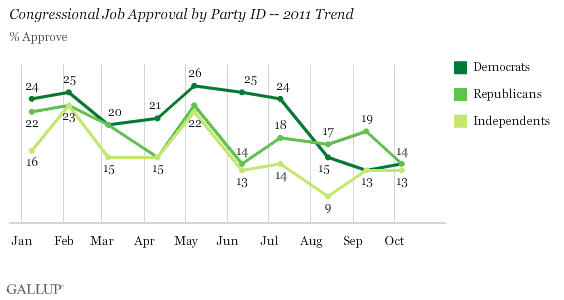
Behind the recent rock-bottom ratings is subpar approval from all three party groups. Republicans' and independents' approval of Congress in 2011 has consistently been below 25%, and more often below 20%. After averaging 24% from January through July, Democrats' approval fell sharply in August, to 15%, and has remained lower than that since.
Currently, Republicans' and Democrats' approval of Congress is identical, at 14%, similar to the 13% among independents.

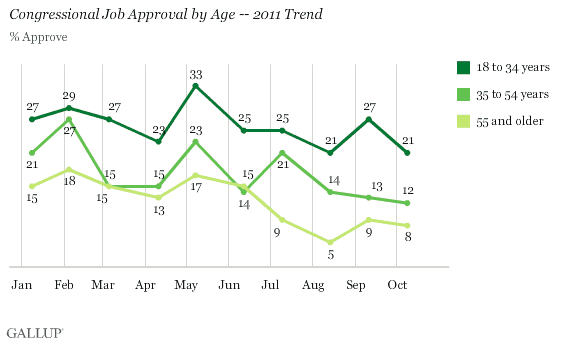
Older Americans are even less favorable toward Congress than the public at large. Eight percent of those 55 and older approved of Congress in October, similar to their single-digit ratings of Congress since July. Approval is not much higher among middle-aged adults, but rises to 21% among those 18 to 34. Young adults have been more supportive of Congress this year than older age groups, similar to their relatively high approval of President Barack Obama. This is consistent with previous Gallup research showing a long-term inverse relationship between congressional approval and age.
These age patterns may be even more pronounced today than historically, and could be relevant to congressional race outcomes if they hold through next year's elections, because older Americans are typically more likely to vote.

Implications
Thus far in 2011, Congress is on track to register its lowest annual average approval rating for any year since Gallup began measuring congressional approval in 1974. The existing lows are 18% recorded in 1992 (based on one measure that year) and 19% recorded in each of three years: 1979 (based on one measure), 2008 (based on monthly ratings), and 2010 (based on monthly ratings).
Congress has received plenty of criticism these days from the political left and right for its performance, and this may be exacerbated by the divided political control in Washington. Given the Republican majority in the U.S. House of Representatives and the Democratic majority in the U.S. Senate, partisans from both major parties may feel at liberty to blame Congress for the nation's problems.
Congress may also be the victim of economic circumstances. As Gallup has demonstrated in previous analysis, congressional approval generally is closely linked with changes in the nation's economy. In periods when GDP was growing at a robust clip, such as in the mid- to late 1990s, congressional approval was relatively high. Since 2006, with GDP growing by less than 3% annually or even decreasing, approval of Congress has been notably meager.
Most recently, at the same time that political friction in Washington, D.C., has seemed to be building, the nation's economy has been slowing. Quarterly GDP growth fell from 3.1% in the fourth quarter of 2010 to 1.9% in the first quarter of 2011 and 1.3% in the second quarter. The result is an undeniably toxic climate for elected officeholders -- and one that is likely to continue to be reflected in low approval of Congress for some time.
Survey Methods
Results for this Gallup poll are based on telephone interviews conducted Oct. 6-9, 2011, with a random sample of 1,005 adults, aged 18 and older, living in all 50 U.S. states and the District of Columbia.
For results based on the total sample of national adults, one can say with 95% confidence that the maximum margin of sampling error is ±4 percentage points.
Interviews are conducted with respondents on landline telephones and cellular phones, with interviews conducted in Spanish for respondents who are primarily Spanish-speaking. Each sample includes a minimum quota of 400 cell phone respondents and 600 landline respondents per 1,000 national adults, with additional minimum quotas among landline respondents by region. Landline telephone numbers are chosen at random among listed telephone numbers. Cell phone numbers are selected using random-digit-dial methods. Landline respondents are chosen at random within each household on the basis of which member had the most recent birthday.
Samples are weighted by gender, age, race, Hispanic ethnicity, education, region, adults in the household, and phone status (cell phone only/landline only/both, cell phone mostly, and having an unlisted landline number). Demographic weighting targets are based on the March 2010 Current Population Survey figures for the aged 18 and older non-institutionalized population living in U.S. telephone households. All reported margins of sampling error include the computed design effects for weighting and sample design.
In addition to sampling error, question wording and practical difficulties in conducting surveys can introduce error or bias into the findings of public opinion polls.
View methodology, full question results, and trend data.
For more details on Gallup's polling methodology, visit www.gallup.com.
