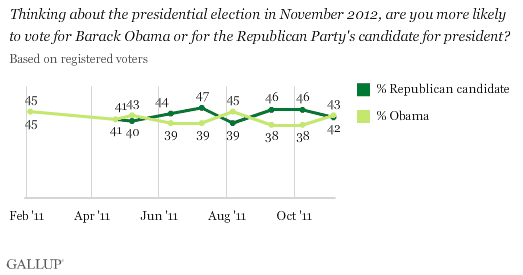
PRINCETON, NJ -- President Obama now essentially ties, 43% to 42%, a "generic" Republican candidate when U.S. registered voters are asked whom they are more likely to vote for in the presidential election next year. This marks a change from October and September, when the Republican candidate was ahead, and underscores the potential for a close presidential race in the year ahead.

Voter preferences on this measure have shifted somewhat from survey to survey over the last year, but support for both Obama and the Republican has varied within a relatively narrow 38% to 47% range.
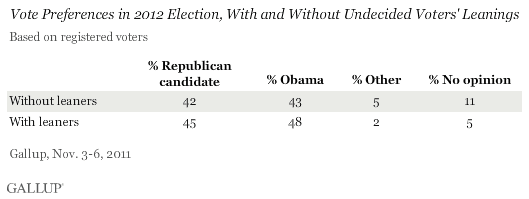
Obama gains two percentage points in his advantage over the Republican when taking into account the leanings of undecided voters, but the two remain in a 48% to 45% statistical tie.

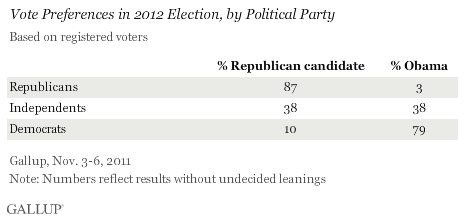
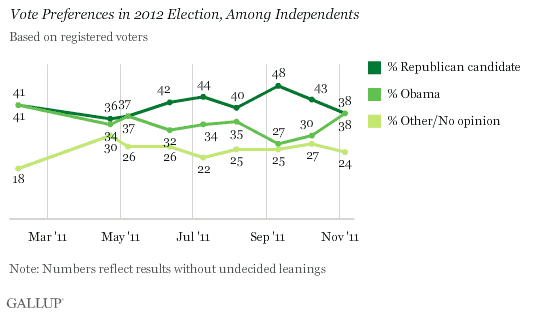
Republicans and Democrats still firmly support their party's candidate, although Democrats are slightly more likely to support the Republican candidate than is the case for Republicans with regard to support for Obama. Independents are split, giving 38% support to each candidate. Obama manages a one-point lead among all registered voters because more identify as Democrats than as Republicans.

The evenness of independents' preferences marks a significant change from September and October, when independents favored the Republican candidate by a significant margin. The current pattern more closely resembles where independents were earlier this year, when Obama and the Republican were evenly matched.

Incumbents Have Met Different Fates Despite Leading Generic Opponents
Gallup has used this measure in two previous years, 1991 and 2003, in which an incumbent president's opponent was still undetermined. In 1991, the measure told the story of a popular president who looked destined to win re-election, and in 2003, the measure told of a less popular president who appeared destined for a close election contest. In the former instance, the dynamic of the election changed substantially as the campaign wore on, while in the latter instance, the election stayed pretty much on the same course.
President George H.W. Bush held a sizable lead in 1991 over the generic Democratic opponent throughout the year, reflecting the high job approval ratings that resulted from the successful Persian Gulf War in February and March 1991 -- ratings that drifted downward but still remained high on a relative basis through most of the year.
By early 1992, however, Bush's ratings had deteriorated well below the 50% level, and at various points thereafter he fell behind independent candidate Ross Perot and then Democrat Bill Clinton in Gallup's trial heat polls -- before losing the election in November.
President George W. Bush led the generic Democratic candidate throughout 2003, although in one October survey his lead was only three points. Bush went on to defeat Democrat John Kerry by a narrow popular-vote margin in 2004.
Implications
The changes in this survey matchup between Obama and a generic Republican candidate no doubt foreshadow the potential political volatility to come over the next 12 months. At this point, it seems safe to conclude that neither Obama nor the Republicans have established a stable or large lead, reasoning underscored by recent Gallup polling showing that Obama is in a dead-even race with one potential GOP nominee -- Mitt Romney -- nationally and in 12 key swing states.
Survey Methods
Results for this Gallup poll are based on telephone interviews conducted Nov. 3-6, 2011, with a random sample of 1,012 adults, aged 18 and older, living in all 50 U.S. states and the District of Columbia.
For results based on the total sample of national adults, one can say with 95% confidence that the maximum margin of sampling error is ±4 percentage points.
For results based on the sample of 889 registered voters, the maximum margin of sampling error is ±4 percentage points.
Interviews are conducted with respondents on landline telephones and cellular phones, with interviews conducted in Spanish for respondents who are primarily Spanish-speaking. Each sample includes a minimum quota of 400 cell phone respondents and 600 landline respondents per 1,000 national adults, with additional minimum quotas among landline respondents by region. Landline telephone numbers are chosen at random among listed telephone numbers. Cell phone numbers are selected using random-digit-dial methods. Landline respondents are chosen at random within each household on the basis of which member had the most recent birthday.
Samples are weighted by gender, age, race, Hispanic ethnicity, education, region, adults in the household, and phone status (cell phone only/landline only/both, cell phone mostly, and having an unlisted landline number). Demographic weighting targets are based on the March 2010 Current Population Survey figures for the aged 18 and older non-institutionalized population living in U.S. telephone households. All reported margins of sampling error include the computed design effects for weighting and sample design.
In addition to sampling error, question wording and practical difficulties in conducting surveys can introduce error or bias into the findings of public opinion polls.
View methodology, full question results, and trend data.
For more details on Gallup's polling methodology, visit www.gallup.com.
