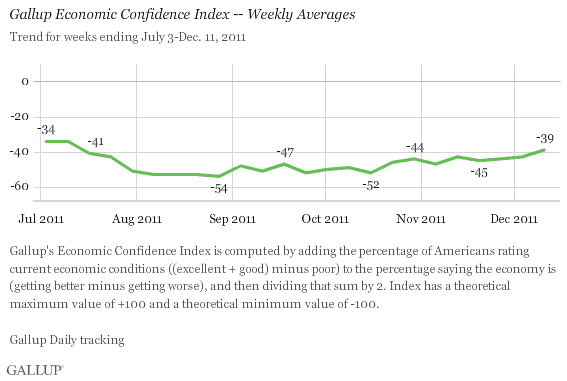
PRINCETON, NJ -- Americans' economic confidence continued to improve during early December, reaching -39 during the week ending Dec. 11 -- its best level since July. Still, economic confidence remains weaker than the -32 of the same week a year ago.

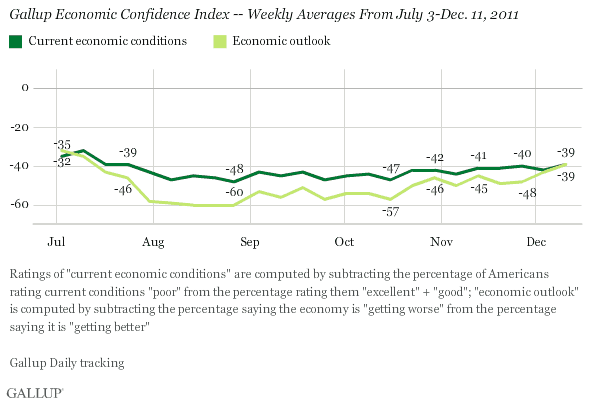
The Gallup Economic Confidence Index is an average of two components: ratings of current economic conditions and Americans' perceptions of whether the U.S. economy is getting better or getting worse. While both dimensions remain highly negative, at -39 each, they have improved to their best levels since July, with the economic outlook showing the greater improvement.

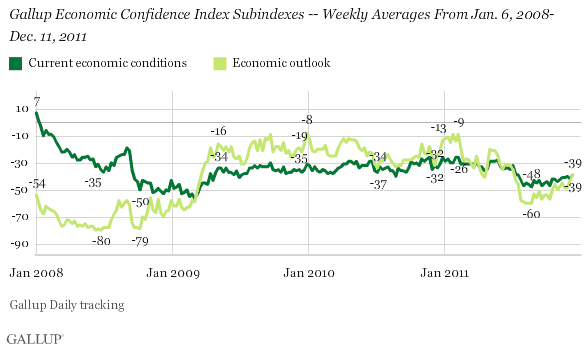
As is the case for the overall index, both dimensions trail their individual matching scores of -32 from a year ago. While the economic conditions dimension was at a similar level of -35 at this point in 2009, the economic outlook dimension was much better at -19.

Bottom Line
Thomson Reuters/University of Michigan stated in its preliminary consumer sentiment report for early December that consumers are now more optimistic than they have been in six months. Gallup's Economic Confidence Index suggests that the final consumer sentiment measure will show an even greater improvement when released later this month. Similarly, the Conference Board's consumer confidence measure to be released on Dec. 27 should reflect a similar substantial improvement.
In part, the current improvement in economic confidence likely reflects the holidays. Although not always the case, consumers often feel more optimistic around Christmas. It appears that this was the case last year, as economic confidence improved to -20 by the week of Dec. 27 to Jan. 2. Even more impressively, the economic outlook dimension improved to -13 during that same year-ending week.
Wall Street's better performance during early December and some optimism that Europe is beginning to address its problems may have played a positive role -- although perceptions of the European situation seem extremely volatile from day to day. Consumer optimism may also have increased in response to the improvement in the recent jobless claims reports and the government's report that the unemployment rate fell to 8.6% in November.
Finally, economic confidence plunged to its lows of the year during the August debt ceiling confrontation, but the recent failure of the congressional supercommittee appears to have had no impact on confidence and might have been generally anticipated. Further, it seems as though at least the congressional leadership in Washington wants to avoid another such confrontation over the extension of the payroll tax cut and the extension of jobless benefits. As a result, the country not only may be seeing a positive effect now on economic confidence but also may avoid a negative impact in the weeks ahead.
While improving economic confidence may not be enough to drive higher consumer spending on its own, it certainly provides the conditions that make it possible. If economic confidence continues to improve in the next few weeks as it did last year, consumer spending during the Christmas holidays may well exceed that of a year ago.
Gallup.com reports results from these indexes in daily, weekly, and monthly averages and in Gallup.com stories. Complete trend data are always available to view and export in the following charts:
Daily: Employment, Economic Confidence and Job Creation, Consumer Spending
Weekly: Employment, Economic Confidence, Job Creation, Consumer Spending
Read more about Gallup's economic measures.
View our economic release schedule.
Survey Methods
Results are based on telephone interviews conducted as part of Gallup Daily tracking Dec. 5-11, 2011, with a random sample of 3,419 adults, aged 18 and older, living in all 50 U.S. states and the District of Columbia. For results based on the total sample of national adults, one can say with 95% confidence that the maximum margin of sampling error is ±2 percentage points.
Interviews are conducted with respondents on landline telephones and cellular phones, with interviews conducted in Spanish for respondents who are primarily Spanish-speaking. Each sample includes a minimum quota of 400 cell phone respondents and 600 landline respondents per 1,000 national adults, with additional minimum quotas among landline respondents by region. Landline telephone numbers are chosen at random among listed telephone numbers. Cell phone numbers are selected using random-digit-dial methods. Landline respondents are chosen at random within each household on the basis of which member had the most recent birthday.
Samples are weighted by gender, age, race, Hispanic ethnicity, education, region, adults in the household, and phone status (cell phone only/landline only/both, cell phone mostly, and having an unlisted landline number). Demographic weighting targets are based on the March 2010 Current Population Survey figures for the aged 18 and older non-institutionalized population living in U.S. telephone households. All reported margins of sampling error include the computed design effects for weighting and sample design.
In addition to sampling error, question wording and practical difficulties in conducting surveys can introduce error or bias into the findings of public opinion polls.
For more details on Gallup's polling methodology, visit www.gallup.com.
