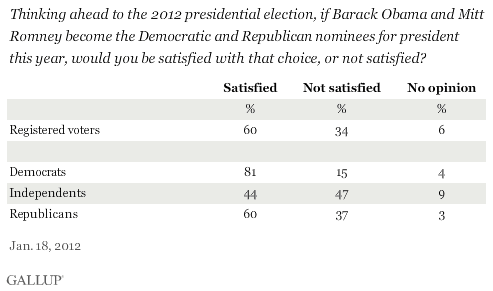
PRINCETON, NJ -- Six in 10 registered voters would be satisfied if Barack Obama and Mitt Romney become the nominees for president this year, while 34% say they would not be satisfied. Democrats are most likely to say they would be satisfied with these two candidates, while independents are least likely.

This USA Today/Gallup poll question was included in Gallup Daily tracking on Jan. 18, and asked of 880 registered voters, in the midst of a continually evolving contest for the GOP nomination. This poll was in the field before Rick Perry's exit from the race on Thursday but after Jon Huntsman dropped out on Monday. Despite extensive news coverage of calls for him to release his tax returns and of the amount he pays in taxes, Romney remains the front-runner nationally, although the situation among Republican voters in South Carolina as Saturday's primary approaches appears to be fluid.
Democrats' satisfaction with an Obama-Romney contest (81%) reflects the reality that Obama has no competition for the Democratic nomination as he seeks a second term. A smaller percentage of Republicans (60%) would be satisfied, but the fact that it is still a majority suggests Romney has the potential to rally his party's followers behind him if he becomes the nominee.
Independents by definition are not attached to the parties, in contrast to those who initially identify as Democrats or Republicans, helping explain why independents are less likely to be satisfied with a choice of only two major-party candidates.
Three-Quarters Would Vote for Either Obama or Romney
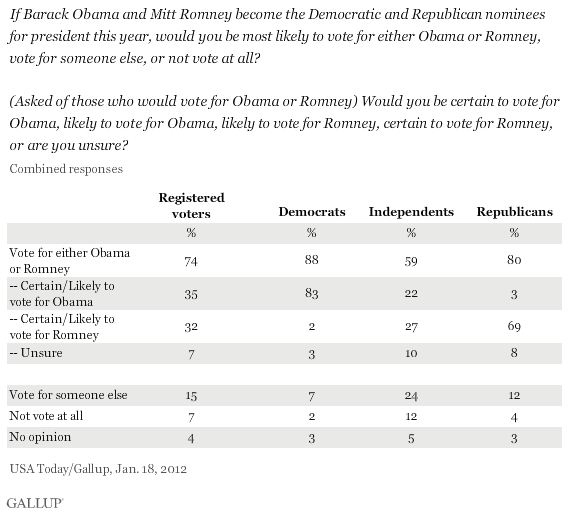
Almost three-quarters (74%) of voters interviewed would vote for either Obama or Romney if those two were the nominees, while the rest say they would vote for someone else or not vote at all.

As was the case in response to the "satisfied" question, Democrats would be most likely to vote for either Obama or Romney (88%), followed by Republicans (80%) and then independents (59%).
Sixteen percent of Republicans say they would vote for someone else or not vote at all if the race turns out to be Obama versus Romney, providing further evidence that Republicans would coalesce around Romney if he becomes the nominee.
Respondents who said they would vote for either Obama or Romney were asked more specifically about their vote choice, and the results show a fairly predictable pattern of projected vote at this juncture. Democrats overwhelmingly would vote for Obama (83%), and Republicans slightly less so for Romney (69%) -- with independents divided. In fact, a majority of Democrats now say -- nearly 10 months before Election Day -- they would be certain to vote for Obama and a majority of Republicans say they would be certain to vote for Romney.
Implications
Even in the midst of a volatile race for the GOP nomination, the significant majority of Republicans would be satisfied with an Obama-Romney choice in the general election, and would end up voting for Romney if these two were the nominees. It is likely that more Republicans would do so if Romney is the GOP nominee and after the current intraparty battles come to an end.
There still appears to be room for a third-party candidate, given that 15% of voters say they would vote for someone other than Romney or Obama, and another 7% say they would not vote at all if that were the choice presented to voters. Additionally, less than half of independents say they would be satisfied if the race is Obama versus Romney. Still, about 6 in 10 independents say they would -- in some instances, apparently begrudgingly -- vote for one of these two candidates if they are on the ballot.
Survey Methods
Results for this USA Today/Gallup poll are based on telephone interviews conducted Jan. 18, 2011, on the Gallup Daily tracking survey, with a random sample of 880 registered voters, aged 18 and older, living in all 50 U.S. states and the District of Columbia.
For results based on the total sample of registered voters, one can say with 95% confidence that the maximum margin of sampling error is ±4 percentage points.
Interviews are conducted with respondents on landline telephones and cellular phones, with interviews conducted in Spanish for respondents who are primarily Spanish-speaking. Each sample includes a minimum quota of 400 cell phone respondents and 600 landline respondents per 1,000 national adults, with additional minimum quotas among landline respondents by region. Landline telephone numbers are chosen at random among listed telephone numbers. Cell phone numbers are selected using random-digit-dial methods. Landline respondents are chosen at random within each household on the basis of which member had the most recent birthday.
Samples are weighted by gender, age, race, Hispanic ethnicity, education, region, adults in the household, and phone status (cell phone only/landline only/both, cell phone mostly, and having an unlisted landline number). Demographic weighting targets are based on the March 2011 Current Population Survey figures for the aged 18 and older non-institutionalized population living in U.S. telephone households. All reported margins of sampling error include the computed design effects for weighting and sample design.
Polls conducted entirely in one day, such as this one, are subject to additional error or bias not found in polls conducted over several days.
In addition to sampling error, question wording and practical difficulties in conducting surveys can introduce error or bias into the findings of public opinion polls.
View methodology, full question results, and trend data.
For more details on Gallup's polling methodology, visit www.gallup.com.
