PRINCETON, NJ -- The Gallup Economic Confidence Index rose five points in February to -22, marking the sixth straight month public confidence has increased after falling to -52 in August, and nearly restoring confidence to what it was last January. The index now roughly matches the highest monthly levels seen in the past four years, although it remains negative.
One important caveat in this otherwise encouraging picture is that Gallup finds confidence declining from early to late February, with the Index dipping to -25 in the most recent week, spanning Feb. 27-March 4. This is the first month in the last half-year that confidence has ended lower than it started.
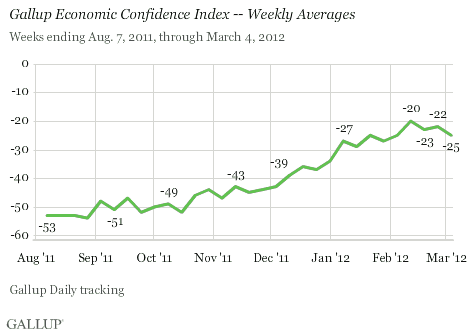
The Gallup Economic Confidence Index is an average of two components of consumers' psychology: Americans' ratings of current economic conditions and their perceptions of whether the economy is getting better or getting worse. The index has a theoretical maximum of +100, obtained if all Americans say the economy is excellent or good and improving. The index could go as low as -100 if all Americans perceive the economy as poor and getting worse.
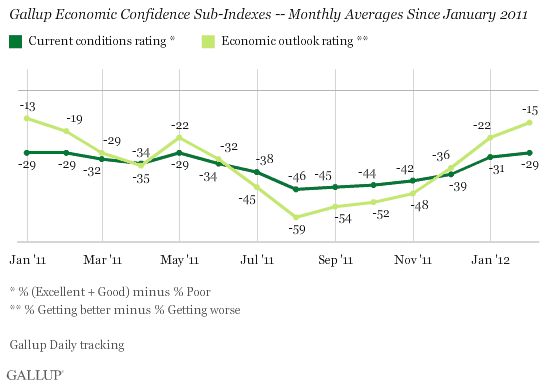
Increasing public optimism about the economy's direction has been mainly responsible for the gains in Americans' overall economic confidence since last summer. This pattern continued in February, as the index's economic outlook component improved seven points, rising to -15 from -22 in January. By contrast, perceptions of current economic conditions barely changed, rising two points to -29 from -31.
More generally, monthly averages of the economic outlook component have fluctuated quite a bit over the past year, while the current conditions component has shifted in a fairly narrow range.
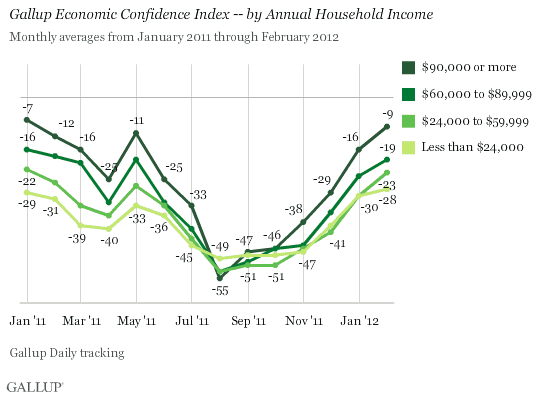
Confidence Gaps by Income Widen in February
Confidence among the highest income group -- those making $90,000 or more annually -- has been improving at an especially fast pace in recent months. This marks a turnaround from the sharp drop in this group's confidence last summer. At that time, upper-income Americans may have taken the more than 2,000-point drop in the stock market -- as well as the related debt ceiling debate crisis -- the hardest. Middle- and upper-middle income Americans' confidence also tumbled at that time but has since rebounded.
As a result of the rebound in these groups' confidence scores, the pattern whereby the highest-income Americans show the most confidence and low-income Americans (those earning less than $24,000 annually) show the least has been fully restored to where it was a year ago.
With a -9 Gallup Economic Confidence Index score in February, the highest-income Americans' confidence is now moving close to positive territory, while, at -28, the lowest income group's still has some distance to go.
Democratic Confidence Turns Positive
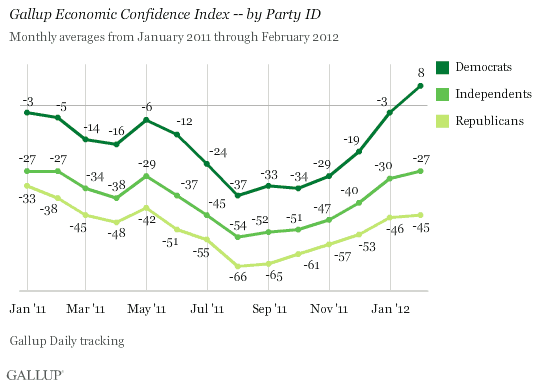
At +8 in February, Democrats' confidence has, in fact, moved into positive territory, marking only the second time any of the three major party groups' monthly confidence has been more positive than negative since Gallup initiated daily economic confidence tracking in January 2008. The higher level of confidence among Democrats reflects that the sitting president is a Democrat; at times when the president was a Republican, Republicans typically had the higher confidence.
Democrats' confidence now exceeds what it was at the start of 2011, while independents' confidence at -27 is the same, and Republicans' is lower.
Bottom Line
Americans' confidence in the economy continued to improve in February, and the -22 overall Economic Confidence Index score for the month roughly matches the highest levels Gallup has seen in four years. This was fueled by continued strong gains among upper-income Americans as well as among Democrats. By contrast, the more modest improvement seen among political independents in recent months could be a political red flag for President Barack Obama, assuming that independents will need to be in a more positive economic mood before they back him for re-election.
Rather than pointing to continued gains in March, Gallup's weekly economic confidence averages show confidence waning over the course of February, perhaps indicating that the burden of rising gas prices is starting to take a toll. What the U.S. Department of Labor has to say this week about February's unemployment picture will also help determine whether confidence continues to flag or jumps further ahead in March.
Gallup.com reports results from these indexes in daily, weekly, and monthly averages and in Gallup.com stories. Complete trend data are always available to view and export in the following charts:
Daily: Employment, Economic Confidence, Job Creation, Consumer Spending
Weekly: Employment, Economic Confidence, Job Creation, Consumer Spending
Read more about Gallup's economic measures.
View our economic release schedule.
Survey Methods
Results are based on telephone interviews conducted as part of Gallup Daily tracking Feb. 1-29, 2012, with a random sample of 13,273 adults, aged 18 and older, living in all 50 U.S. states and the District of Columbia.
For results based on the total sample of national adults, one can say with 95% confidence that the maximum margin of sampling error is ±1 percentage point.
Interviews are conducted with respondents on landline telephones and cellular phones, with interviews conducted in Spanish for respondents who are primarily Spanish-speaking. Each sample includes a minimum quota of 400 cell phone respondents and 600 landline respondents per 1,000 national adults, with additional minimum quotas among landline respondents by region. Landline telephone numbers are chosen at random among listed telephone numbers. Cell phone numbers are selected using random-digit-dial methods. Landline respondents are chosen at random within each household on the basis of which member had the most recent birthday.
Samples are weighted by gender, age, race, Hispanic ethnicity, education, region, adults in the household, and phone status (cell phone only/landline only/both, cell phone mostly, and having an unlisted landline number). Demographic weighting targets are based on the March 2011 Current Population Survey figures for the aged 18 and older non-institutionalized population living in U.S. telephone households. All reported margins of sampling error include the computed design effects for weighting and sample design.
The questions reported here were asked of a random half-sample of respondents for 27 nights on the Gallup Daily tracking survey.
In addition to sampling error, question wording and practical difficulties in conducting surveys can introduce error or bias into the findings of public opinion polls.
For more details on Gallup's polling methodology, visit www.gallup.com.
