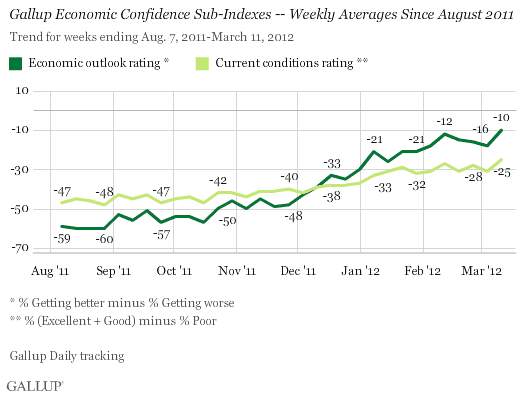
PRINCETON, NJ -- U.S. economic confidence improved sharply to -18 in the week ending March 11 from -25 the prior week -- the highest since the week ending Feb. 13, 2011, when it was also -18. The -18 readings this year and last are the highest weekly levels Gallup has recorded since it started tracking confidence daily in January 2008.

Americans' economic confidence had declined recently from -20 in the week ending Feb. 12 to -25 for the week ending March 4. This brief deterioration in confidence may have been, at least in part, a response to increasing gas prices at the pump. However, the government's positive unemployment report out last Friday appears to have given economic confidence another boost, as seemed to be the case following January's unemployment report.
Gallup Daily tracking reveals that Americans' confidence in the economy increased Friday, Saturday, and Sunday after the government report came out.
The Gallup Economic Confidence Index is an average of two components: Americans' ratings of current economic conditions and their perceptions of whether the economy is getting better or getting worse. Improvements in both dimensions led to the sharp increase in overall economic confidence for the week ending March 11.

The percentage of Americans saying the economy is "getting better" increased to 43% last week, while the percentage saying it is "getting worse" fell to 53%. Both of these measures are at their best levels since the 43% "getting better" and 52% "getting worse" of the week ending Feb. 13, 2011.
In a separate question, consumers' "poor" rating of the economy is now at 39%. This is the lowest "poor" rating for current economic conditions since the week ending March 9, 2008.
Bottom Line
Americans' confidence in the economy surged last week, at least in part as a result of the positive unemployment report from the government, which it released Friday. The government reported 227,000 jobs were added in February and the unemployment rate held steady at 8.3%. Many viewed these numbers as a continuation of the good news on jobs in January. Some economists and many on Wall Street also saw the recent unemployment report as an indication that the U.S. economy may be doing better than previously thought.
This improvement in consumer perceptions is taking place despite sharply higher gas prices at the pump. In this regard, Gallup data find gas prices would need to climb to more than $5 per gallon before consumers would need to significantly alter their lifestyles. Of course, increasing gas prices may have a negative effect on consumer economic perceptions far before they reach the $5 per gallon infliction point.
It is important to note that Americans' confidence in the economy was similar last year around this time. However, Americans' hope for improvement in the overall economy during the months that followed the momentary surge in confidence early last year did not materialize. In fact, by last summer, the economy appeared to be near another downturn as politicians in the nation's capital did battle over raising the federal debt ceiling.
It appears economic confidence is at another possible turning point, with gas prices on a pace to reach record highs in the summer. Further, it is not clear if the government can continue to report more good jobs news given modest economic growth.
For now though, it appears that higher gas prices have not been enough to keep Americans' economic confidence from matching its highest weekly level in four years. However, if job increases slow, gas prices may quickly be perceived as an even more important threat, not only to Americans' economic confidence, but also to the overall economy in the months ahead.
Gallup.com reports results from these indexes in daily, weekly, and monthly averages and in Gallup.com stories. Complete trend data are always available to view and export in the following charts:
Daily: Employment, Economic Confidence, Job Creation, Consumer Spending
Weekly: Employment, Economic Confidence, Job Creation, Consumer Spending
Read more about Gallup's economic measures.
View our economic release schedule.
Survey Methods
Results are based on telephone interviews conducted as part of the Gallup Daily tracking survey with a random sample of more than 2,000 adults, aged 18 and older, living in all 50 U.S. states and the District of Columbia, selected using random-digit-dial sampling.
For results based on the total sample of national adults, one can say with 95% confidence that the maximum margin of sampling error is ±3 percentage points.
Results for the week ending March 11, 2012, are based on telephone interviews conducted as part of the Gallup Daily tracking survey with 3,405 adults, aged 18 and older, living in all 50 U.S. states and the District of Columbia, selected using random-digit-dial sampling. For results based on this weekly sample of national adults, one can say with 95% confidence that the maximum margin of sampling error is ±3 percentage points.
Interviews are conducted with respondents on landline telephones and cellular phones, with interviews conducted in Spanish for respondents who are primarily Spanish-speaking. Each sample includes a minimum quota of 400 cell phone respondents and 600 landline respondents per 1,000 national adults, with additional minimum quotas among landline respondents by region. Landline telephone numbers are chosen at random among listed telephone numbers. Cell phone numbers are selected using random-digit-dial methods. Landline respondents are chosen at random within each household on the basis of which member had the most recent birthday.
Samples are weighted by gender, age, race, Hispanic ethnicity, education, region, adults in the household, and phone status (cell phone only/landline only/both, cell phone mostly, and having an unlisted landline number). Demographic weighting targets are based on the March 2011 Current Population Survey figures for the aged 18 and older non-institutionalized population living in U.S. telephone households. All reported margins of sampling error include the computed design effects for weighting and sample design.
In addition to sampling error, question wording and practical difficulties in conducting surveys can introduce error or bias into the findings of public opinion polls.
For more details on Gallup's polling methodology, visit www.gallup.com.
