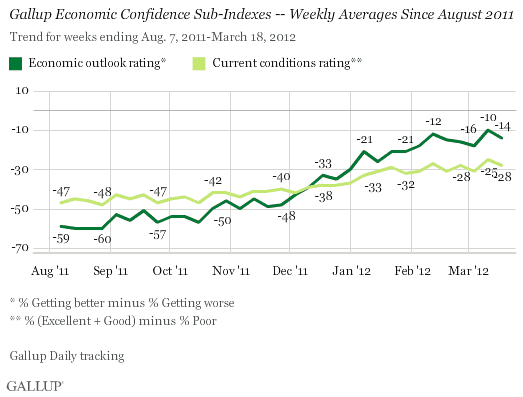
PRINCETON, NJ -- U.S. economic confidence worsened to -21 in the week ending March 18 from the four-year high of -18 the prior week. Once again last week, economic confidence failed to break through its previous highs of -18. Economic confidence is now not much different than it was during the same week one month ago at -23.

Americans' economic confidence surged during the week ending March 11, matching its best level since Gallup Daily tracking began in January 2008. Part of this improvement was likely due to the U.S. government's positive unemployment report released Friday, March 9. Gallup Daily tracking showed an increase in economic confidence during the Friday, Saturday, and Sunday immediately after the government reported that more than 200,000 jobs were added in February and that the unemployment rate remained unchanged.
The exact reason for the slight deterioration in confidence last week is difficult to determine. One proximate cause could be -- at least to some degree -- continually increasing gas prices at the pump. Gas prices are not only approaching the psychologically important price of $4.00 a gallon, but are expected to exceed $5.00 a gallon in some areas in the months ahead. Gallup finds that Americans on average say they would not significantly change their lifestyles until gas prices reach the tipping point of $5.30, suggesting that the true impact of current gas prices on economic confidence is difficult to assess with certainty. Further, despite the latest decline in confidence and the surging gas prices, economic confidence remains better now than it was during the same week one year ago (-31).
The Gallup Economic Confidence Index includes two components: Americans' ratings of current economic conditions and their perceptions of whether the economy is getting better or getting worse. Slight deteriorations along both dimensions drove the latest downtick in overall economic confidence.

The percentage of Americans saying the economy is "getting better" fell to 41% last week from 43% the prior week. The percentage saying the economy is "getting worse" increased to 55% from 53%. Both of these measures are very close to where they were during this same week one month ago.
The number of consumers rating the economy "poor" increased to 42% last week from 39% the week ending March 11. This is also similar to the 43% who rated the economy "poor" during this same week one month ago.
Bottom Line
Americans' economic confidence has been volatile in recent weeks. Widespread discussion of increasing gas prices by the press and politicians, as well as the financial hardship they cause many Americans, may have, at least in part, been responsible for the decline in confidence in the week ending March 18. This may further depress consumers' attitudes -- especially if gas prices remain high or continue to increase.
The U.S. government's unemployment report for February may have temporarily offset any gas price drag on confidence during the week that ended March 11. The favorable response on Wall Street and the general perception that the U.S. economy is doing better also may be causing consumers to be more confident. However, the positive impact of the good jobs news may have faded somewhat during the week ending March 18.
As a result of these various elements, U.S. economic confidence may remain relatively volatile in the weeks ahead. Despite some modestly positive economic news, Americans may sense that continued economic growth will be difficult if gas prices continue to increase. This was the case in late 2007 and early 2008 as gas prices surged before peaking at $4.11 in July 2008. Though the impact of surging gas prices was not fully acknowledged at the time, it was later determined that the recession actually began in December 2007.
President Barack Obama's job approval is also likely to be volatile if economic confidence remains so, as Gallup finds that the two are fairly well linked. As such, Gallup Daily tracking of U.S. economic confidence remains an important way to monitor the fluctuating perceptions of consumers and voters alike.
Gallup.com reports results from these indexes in daily, weekly, and monthly averages and in Gallup.com stories. Complete trend data are always available to view and export in the following charts:
Daily: Employment, Economic Confidence, Job Creation, Consumer Spending
Weekly: Employment, Economic Confidence, Job Creation, Consumer Spending
Read more about Gallup's economic measures.
View our economic release schedule.
Survey Methods
Results are based on telephone interviews conducted weekly as part of Gallup Daily tracking with a random sample of more than 2,000 adults aged 18 and older, living in all 50 U.S. states and the District of Columbia, selected using random-digit-dial sampling.
For results based on the total sample of national adults, one can say with 95% confidence that the maximum margin of sampling error is ±3 percentage point.
Results for the week ending March 18, 2012 are based on 3,433 telephone interviews conducted as part of Gallup Daily tracking with adults aged 18 and older, living in all 50 U.S. states and the District of Columbia, selected using random-digit-dial sampling. For results based on this weekly sample of national adults, one can say with 95% confidence that the maximum margin of sampling error is ±3 percentage point.
Interviews are conducted with respondents on landline telephones and cellular phones, with interviews conducted in Spanish for respondents who are primarily Spanish-speaking. Each daily sample includes a minimum quota of 150 cell phone respondents and 850 landline respondents, with additional minimum quotas among landline respondents for gender within region. Landline respondents are chosen at random within each household on the basis of which member had the most recent birthday.
Samples are weighted by gender, age, race, Hispanic ethnicity, education, region, adults in the household, cell-phone-only status, cell-phone-mostly status, and phone lines. Demographic weighting targets are based on the March 2009 Current Population Survey figures for the aged 18 and older non-institutionalized population living in U.S. telephone households. All reported margins of sampling error include the computed design effects for weighting and sample design.
In addition to sampling error, question wording and practical difficulties in conducting surveys can introduce error or bias into the findings of public opinion polls.
For more details on Gallup's polling methodology, visit https://www.gallup.com/.
