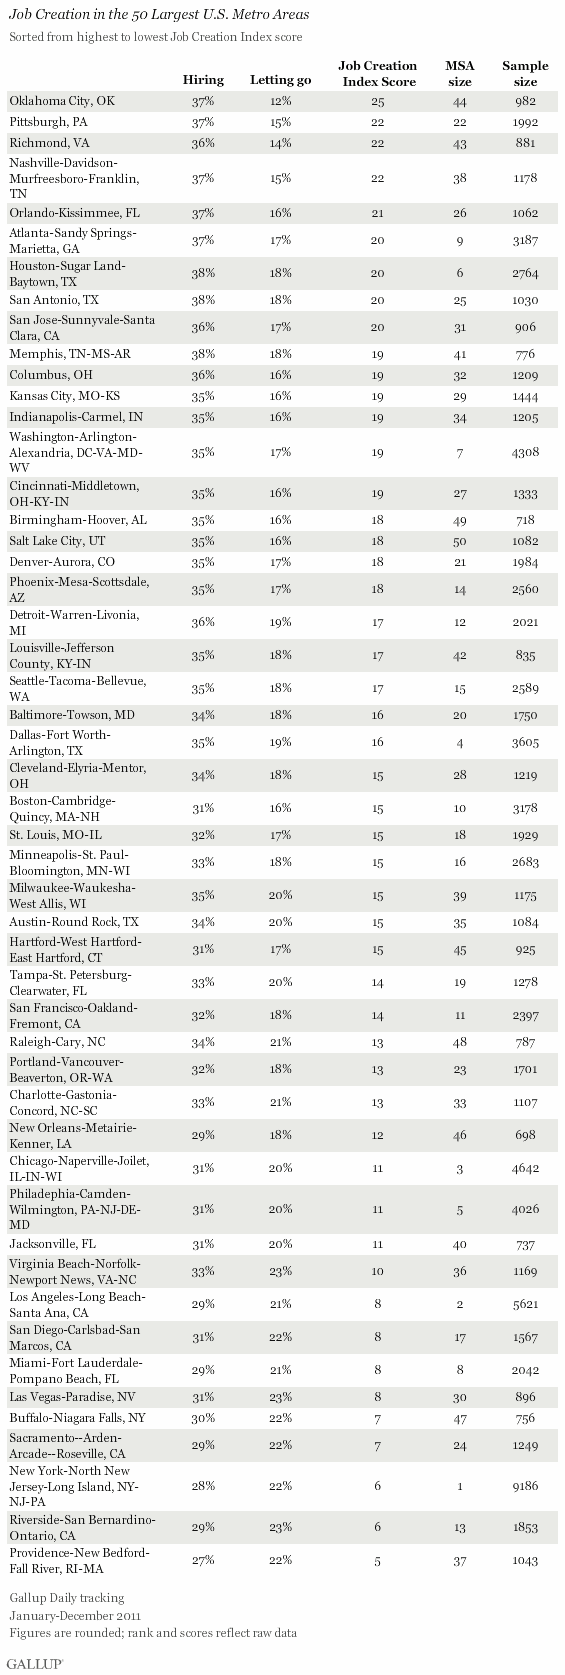
WASHINGTON, D.C. -- Oklahoma City, Okla., had the highest score on Gallup's Job Creation Index among the 50 largest U.S. metro areas in 2011, followed by Pittsburgh, Pa., and several Southern metros. More than one in three workers in each of the top-performing metro areas said their employer was hiring or expanding the size of its workforce, but Oklahoma City led because of the relatively low percentage of workers (12%) who said their employer was letting workers go or decreasing the size of its workforce.

The metro areas surrounding Richmond, Va., Nashville, Tenn., and Orlando, Fla., complete the top five large metro areas with the highest Job Creation Index scores.
 |
| Explore complete state data > |
The results are based on Gallup Daily tracking interviews with U.S. workers conducted from January-December 2011. Gallup interviewed at least 698 respondents in each of the 50 largest metro areas in 2011, including 1,000 or more in 38 metro areas. Nationwide in 2011, an average of 31% of U.S. workers said their employer was hiring, while 18% said their employer was letting workers go, for a U.S. Job Creation Index score of +13.
The top-performing large metro areas have above-average hiring levels combined with below-average levels of letting go, resulting in high Job Creation Index scores. On the other side of the spectrum, some metro areas have relatively low hiring combined with high levels of letting go, resulting in low Job Creation Index scores.
Providence, R.I., Riverside, Calif., New York City, Sacramento, Calif., and Buffalo, N.Y., rank as the bottom five in net hiring among large U.S. metro areas. Still, in each of these metro areas, more employees reported hiring than firing, but the differences were in the single digits.

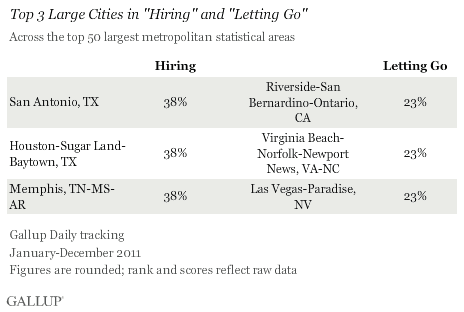
The individual components of the metric reveal some other successes and challenges. The San Antonio, Houston, and Memphis, Tenn., metro areas reported the most hiring, while the Riverside, Calif., Virginia Beach, Va., and Las Vegas metro areas reported the most letting go.

The large metro areas in the South tend to have better job creation situations than those in the East and the West. Eight of the top 10 metro areas with the highest Job Creation Index scores are in the South, while eight of the bottom 10 are in the East or West.
It should also be noted that the largest metro areas overall -- New York, Los Angeles, and Chicago -- ranked closer to the bottom of the list than to the top.
Gallup's Job Creation Index tends to be a strong predictor of jobless claims at the national level, and these results at the local level may also be an indicator of future local unemployment rates. The top five large metros in Gallup's Job Creation Index for 2011 had an average unemployment rate of 7.4% in January 2012, according to not-seasonally adjusted data from the U.S. Bureau of Labor Statistics, while the bottom five large metros' unemployment rates averaged 10.7%.
Implications
A positive takeaway from these numbers is that every one of the top 50 U.S. metro areas has a positive Job Creation Index score, indicating there is more hiring than firing going on in the nation's largest cities. At the same time, the high degree of local variation makes clear that some cities are doing very well, while others are not doing as well on a relative basis. The data also provide additional insight beyond what is happening at the state and national level.
Because Gallup's Job Creation Index is based on employees' perceptions about their own place of work, the data do not necessarily reflect the magnitude of hiring or firing that is taking place and, further, employees living in these areas may be reporting workforce expansion and contraction that is happening outside their own location.
Still, the local variation showcases the overall job creation momentum in a given area and indicates where job seekers may be more likely to find jobs. This variation is likely influenced by factors such as company and community leadership, policy, geography, and industry. Leaders should recognize that job creation is a local problem that requires local solutions. While job creation and loss are to some extent a natural and healthy part of economic growth and change, cities that are able to outperform others in terms of creating the good jobs of tomorrow will achieve significantly better outcomes for their residents.
Survey Methods
Results are based on telephone interviews conducted as part of Gallup Daily tracking from January-December 2011 with a random sample of 96,349 employed adults, aged 18 and older, living in the 50 largest U.S. Metropolitan Statistical Areas.
Margins of error for individual metro areas are no more than ±5 percentage points in all areas, and ±3 percentage points or less in most metro areas.
Interviews are conducted with respondents on landline telephones and cellular phones, with interviews conducted in Spanish for respondents who are primarily Spanish-speaking. Each sample includes a minimum quota of 400 cell phone respondents and 600 landline respondents per 1,000 national adults, with additional minimum quotas among landline respondents by region. Landline telephone numbers are chosen at random among listed telephone numbers. Cell phone numbers are selected using random-digit-dial methods. Landline respondents are chosen at random within each household on the basis of which member had the most recent birthday.
Samples are weighted by gender, age, race, Hispanic ethnicity, education, region, adults in the household, and phone status (cell phone only/landline only/both, cell phone mostly, and having an unlisted landline number). Demographic weighting targets are based on the March 2011 Current Population Survey figures for the aged 18 and older non-institutionalized population living in U.S. telephone households. All reported margins of sampling error include the computed design effects for weighting and sample design.
In addition to sampling error, question wording and practical difficulties in conducting surveys can introduce error or bias into the findings of public opinion polls.
For more details on Gallup's polling methodology, visit www.gallup.com.

