PRINCETON, NJ -- Americans' financial comfort is the lowest Gallup has measured to date, with 60% saying they currently have enough money to live comfortably and 39% saying they do not. Americans' peace of mind with their finances was fairly stable at a high level from the first asking of the question in 2002 through 2007, but has since faltered.
These results are from Gallup's annual Economy and Personal Finance poll, conducted each April. The 2012 survey was conducted April 9-12.
Americans' sense of their personal financial comfort is directly related to how much college education they have, with the major divide evident between those with a college degree and those with lower levels of formal education.
College graduates' financial comfort has declined relatively little over the past decade, from 86% in 2002 to 80% today. That compares with a 20-percentage-point decline among those who are not college graduates, from 71% to 51%, over the same time period.
This strong educational aspect of financial security is also reflected in Gallup's trends by income.
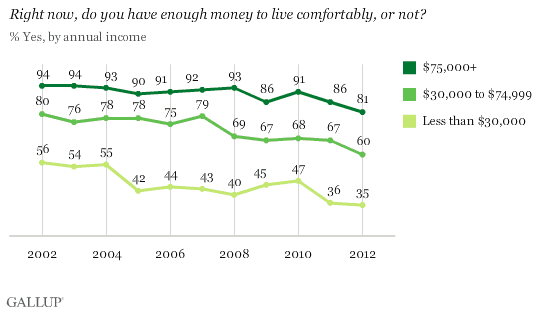
The large majority of upper-income Americans -- those whose household incomes are $75,000 or more per year -- as well as more than half of middle-income Americans ($30,000 to $74,999) currently believe they have enough money to live comfortably. By contrast, most Americans with incomes of less than $30,000 a year do not.
This comfort metric has fallen among all three groups over the past decade; however, since 2002, it has declined by about 20 points among middle- and lower-income Americans, compared with a 13-point drop among upper-income Americans.
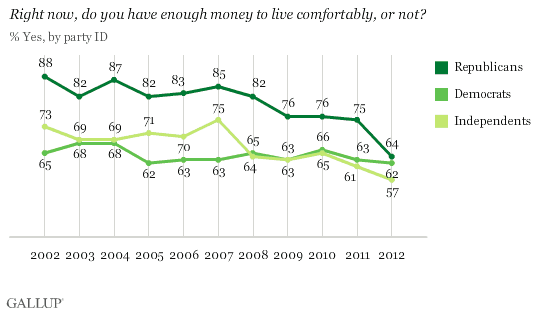
Additionally, there may be a political component to how people feel about their finances. Long-term, Republicans, who tend to have higher incomes, have been the most confident about what they make, and Democrats, who tend to have lower incomes, the least. However, the gap between Republican and Democratic comfort has narrowed since President Barack Obama took office in 2009. And, in just the past year, the percentage of Republicans saying they have enough to live comfortably fell to 64%, down from 75% in April 2011. That 11-point decline contrasts with a four-point decline among independents and a one-point decline among Democrats.
Aside From Money, Top Financial Problems Are Healthcare and Housing Costs
The same poll asks Americans to identify the most important financial problem facing their family, which provides some insight into why Americans may be less financially comfortable. Overall, the most common response is lack of money or income, followed by healthcare costs, the costs of owning/renting a home, the high cost of living, and energy costs. Of these, mentions of lack of money, the cost of owning a home, and energy costs are higher than when last measured in October. (See link in Survey Methods for recent trends.)
Americans who don't have enough money to live comfortably are twice as likely as those who are living comfortably to say that lack of money or low wages is their top financial problem. They are also more likely to cite the high cost of living, trouble paying their debts, and unemployment as major concerns. At the same time, they are less likely than financially comfortable Americans to say they worry about college expenses, taxes, or saving for retirement.
Bottom Line
Although the economy is growing faster than it was a year ago, unemployment is lower, and consumer spending is higher, Americans' comfort with their finances is the lowest Gallup has seen in a decade. This is partly the result of a long-term decline in the financial comfort of people already at risk economically -- those with no college degree or with middle to low incomes. However, the trend line was punctuated this year by a downturn in comfort among upper-income Americans and Republicans. These groups may be reacting to President Obama's recent emphasis on having the rich pay a greater share of their income in taxes, or simply responding more politically to the question this year, given that it is a presidential election year with Obama seeking a second term.
Survey Methods
Results for this Gallup poll are based on telephone interviews conducted April 9-12, 2012 with a random sample of 1,016 adults, aged 18 and older, living in all 50 U.S. states and the District of Columbia.
For results based on the total sample of national adults, one can say with 95% confidence that the maximum margin of sampling error is ±4 percentage points.
Interviews are conducted with respondents on landline telephones and cellular phones, with interviews conducted in Spanish for respondents who are primarily Spanish-speaking. Each sample includes a minimum quota of 400 cell phone respondents and 600 landline respondents per 1,000 national adults, with additional minimum quotas among landline respondents by region. Landline telephone numbers are chosen at random among listed telephone numbers. Cell phone numbers are selected using random-digit-dial methods. Landline respondents are chosen at random within each household on the basis of which member had the most recent birthday.
Samples are weighted by gender, age, race, Hispanic ethnicity, education, region, adults in the household, and phone status (cell phone only/landline only/both, cell phone mostly, and having an unlisted landline number). Demographic weighting targets are based on the March 2011 Current Population Survey figures for the aged 18 and older non-institutionalized population living in U.S. telephone households. All reported margins of sampling error include the computed design effects for weighting and sample design.
In addition to sampling error, question wording and practical difficulties in conducting surveys can introduce error or bias into the findings of public opinion polls.
View methodology, full question results, and trend data.
For more details on Gallup's polling methodology, visit www.gallup.com.
