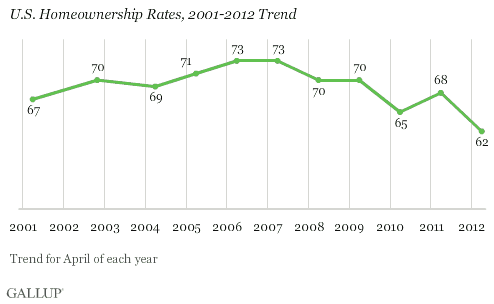
PRINCETON, NJ - The 62% of Americans who say they own their own home marks a new low since Gallup began tracking self-reported homeownership in 2001.

The current level of homeownership marks a decline from 68% in 2011. For most of the prior decade, roughly seven in 10 Americans reported owning their own home. While the recession and financial crisis took place in 2008-2009, homeownership rates didn't begin to reflect the bursting of the housing bubble until 2010, when 65% of Americans reported owning their own home -- the lowest level recorded before this year.
Record-Low 53% of Americans Say Their Home's Value Has Increased
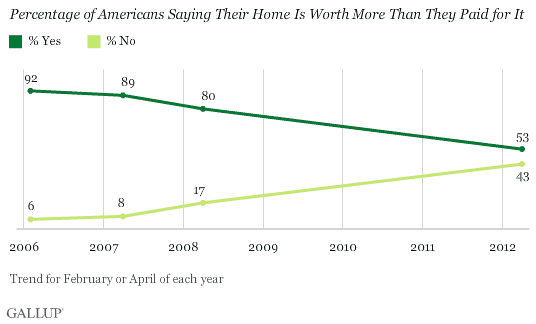
Fifty-three percent of Americans believe their house is worth more today than when they bought it, down significantly from 80% in 2008 and 92% in 2006. It confirms that many Americans are underwater in terms of the value of the home they currently own.

Houses that were purchased many years ago, well before the collapse of the real estate market, are more likely to be worth more today than when they were bought. Accordingly, older Americans are less likely to say their home's value has not appreciated since they bought it -- 31% of Americans aged 50 and older say this. In contrast, 62% of Americans aged 30 to 49, many of whom likely bought homes closer to the collapse, say their home is not worth more.
Still, Most Americans Say Now Is a Good Time to Buy
Lower home prices combined with continued low mortgage interest rates have 70% of Americans believing now is a "good time" to buy a house. This is about the same as in the past several years, but up from 53% in 2008.

More Americans Expect Local House Prices to Increase Than Decrease
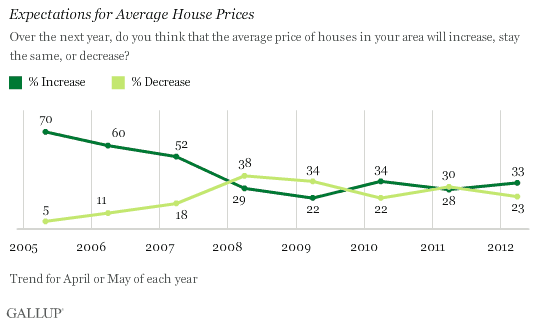
Americans are much more positive about the direction of housing prices this year than they were last year. They are significantly more likely to expect the average price of houses in their area to increase over the next 12 months than to decrease, 33% vs. 23%. Last year, Americans were about evenly split, 28% to 30%.

Today's housing price expectations differ sharply from those during the housing price boom. In 2005, 70% of Americans expected house prices in their area to increase, while 5% expected them to decrease. Expectations moderated as prices hit record levels in 2006-2007. Expectations became more negative during the recession and financial crisis. In 2010, price expectations were similar to those anticipated today.
Implications
Most Americans recognize that now is likely a good time to buy a house. Mortgage rates remain at historical lows and Federal Reserve policy seems determined to keep them low for some time to come. While recent Case-Shiller measurements show home prices declining, about one in three Americans expect house prices to increase over the next 12 months and another 44% expect prices to remain unchanged. Relatively stable prices and low interest rates would seem to make buying a house extremely attractive in many local housing markets.
Part of the explanation for decade-low homeownership likely has to do with today's broken housing finance system that depends on Fannie Mae, Freddie Mac, and FHA/VA. Potential home buyers can take advantage of today's low mortgage interest rates only if they can meet significantly more stringent down payment and underwriting standards than was the case prior to the financial crisis.
Further, while record home foreclosures and distress sales resulting in declining house values have also played a role in the declining rate of homeownership in recent years, so has the weakness of the overall economy. Buying a home is the most important purchase and largest financial commitment most people make during their lives. For most Americans, it is hard to feel secure enough to make such a commitment when the economy is growing slowly and they see nearly one in five workers underemployed, that is, unemployed or employed part time but willing to work full time.
Declining homeownership rates suggest some Americans are beginning to doubt that homeownership remains part of the American dream -- or at least, an attainable part of it. From an economic perspective, U.S. economic growth needs to be much stronger than it has been in order to achieve the hiring necessary to get unemployment rates to the "normal" levels of the past. This doesn't seem likely as long as housing activity remains relatively moribund and homeownership rates are declining.
Survey Methods
Results for this Gallup poll are based on telephone interviews conducted April 9-12, 2012, with a random sample of 1,016 adults, aged 18 and older, living in all 50 U.S. states and the District of Columbia.
For results based on the total sample of national adults, one can say with 95% confidence that the maximum margin of sampling error is ±4 percentage points.
Interviews are conducted with respondents on landline telephones and cellular phones, with interviews conducted in Spanish for respondents who are primarily Spanish-speaking. Each sample includes a minimum quota of 400 cell phone respondents and 600 landline respondents per 1,000 national adults, with additional minimum quotas among landline respondents by region. Landline telephone numbers are chosen at random among listed telephone numbers. Cell phone numbers are selected using random-digit-dial methods. Landline respondents are chosen at random within each household on the basis of which member had the most recent birthday.
Samples are weighted by gender, age, race, Hispanic ethnicity, education, region, adults in the household, and phone status (cell phone only/landline only/both, cell phone mostly, and having an unlisted landline number). Demographic weighting targets are based on the March 2011 Current Population Survey figures for the aged 18 and older non-institutionalized population living in U.S. telephone households. All reported margins of sampling error include the computed design effects for weighting and sample design.
In addition to sampling error, question wording and practical difficulties in conducting surveys can introduce error or bias into the findings of public opinion polls.
View methodology, full question results, and trend data.
For more details on Gallup's polling methodology, visit www.gallup.com.
