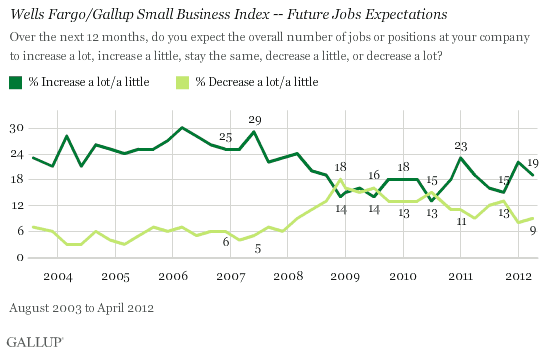
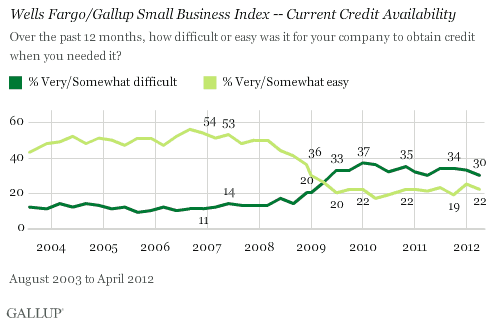
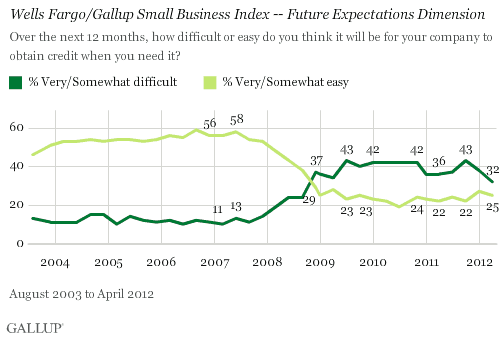
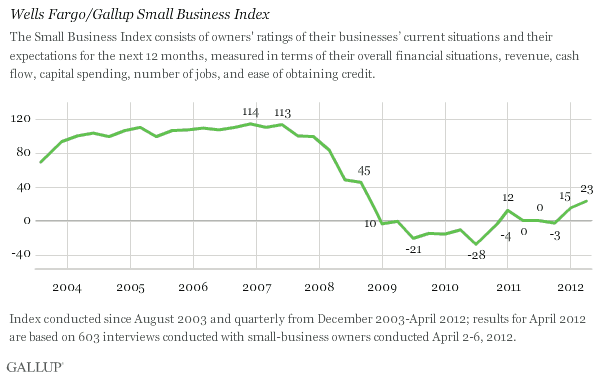
PRINCETON, NJ -- The Wells Fargo/Gallup Small Business Index, a measure of small-business owners' perceptions of their operating environments, increased to 23 in April from 15 in January. This is the index's highest level since July 2008, though still well below where it was in 2006-2007, prior to the recession.
The survey was conducted April 2-6, 2012, with a random sample of 603 small-business owners.
The index, which tends to be a precursor of future economic activity, was initiated in August 2003 and peaked late in 2006 at 114. It essentially matched that reading in June 2007, just prior to the beginning of the recession in December. It then consistently declined through 2008 and into mid-2009, as the recession and financial crisis deepened. The index fell to its lowest point -- -28 -- in July 2010. Since that point, it has steadily improved, with the 2012 levels showing the index has recovered significantly, but not yet to pre-recession levels.
Future Expectations Also Best Since July 2008
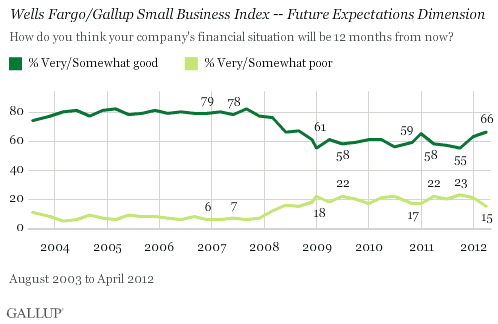
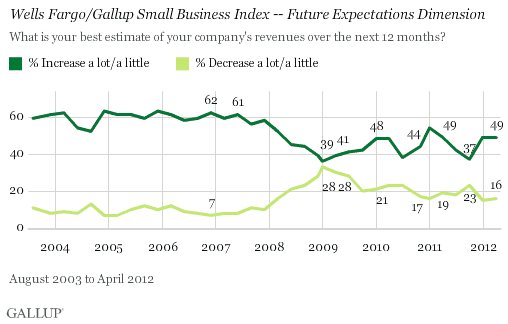
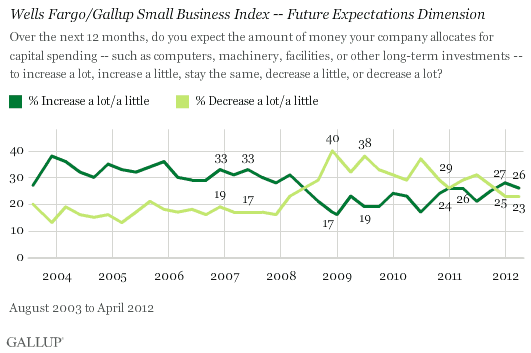
The Future Expectations Dimension of the index is up to 24 in April from 21 in January. Small-business owners' expectations for the next 12 months are now the most positive they have been at any time since July 2008.
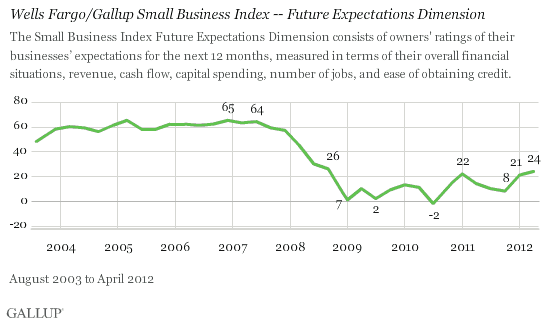
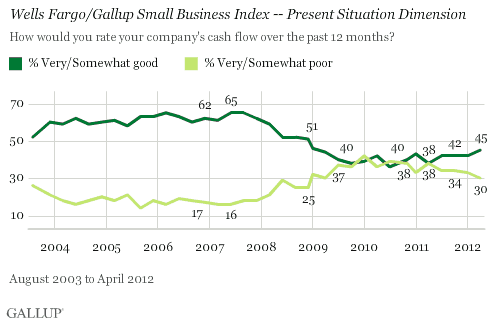
Specifically, small-business owners' expectations for the next 12 months improved in terms of their overall financial situation, cash flows, and credit availability. (See complete data and trends from the Wells Fargo/Gallup Small Business Index on page 2.) Small-business owners' future expectations are primarily responsible for the overall index's positive reading at this point.
Present Situation Ratings Improve Too, Into Neutral Territory
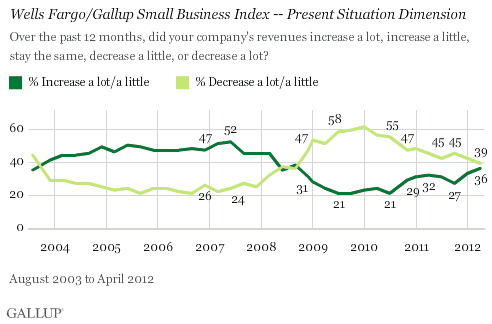
Overall operating conditions as reflected by the Present Situation Dimension of the index reached -1 in April -- an improvement from January's -6 -- which is the highest rating for this dimension since November 2008.
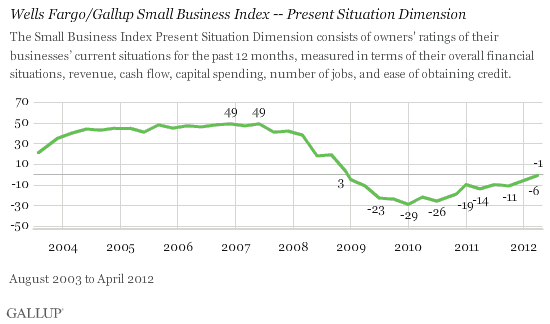
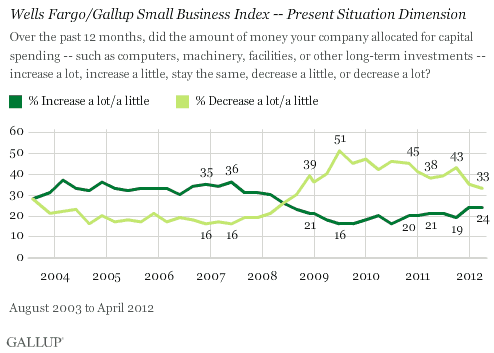
Specifically, small-business owners' assessments of their operating conditions over the past 12 months improved modestly in terms of their revenues, cash flows, and credit availability.
Implications
Increased optimism among small-business owners is consistent with Gallup's monitoring of overall economic confidence among U.S. consumers more broadly. Americans' confidence has recently been near its highs of the past four years. Like small-business owner optimism, Americans' confidence about the future direction of the U.S. economy remains more positive than perceptions of current conditions.
In January 2011, the Wells Fargo/Gallup Small Business Index turned positive for the first time since late 2008. However, small-business owners' optimism fell back into neutral for the remainder of the year. This year, small-business owner optimism has increased for two consecutive quarters, perhaps suggesting a sustained increase and providing hope that in 2012, owners' expectations are more likely to be realized.
Increasing small-business owner optimism is key to future U.S. economic growth and job creation. It may well determine whether the economy builds on the optimism of the first four months of this year or reverses course, as it did last year.
See complete data and trends from the Wells Fargo/Gallup Small Business Index on page 2.
About the Wells-Fargo Small Business Index
Since August 2003, the Wells Fargo/Gallup Small Business Index has surveyed small business owners on current and future perceptions of their business financial situation.
Survey Methods
Results for the total dataset are based on telephone interviews with 603 small business owners, conducted April 2-6, 2012. For results based on the total sample of small business owners, one can say with 95% confidence that the maximum margin of sampling error is ±4 percentage points.
Sampling is done on an RDD basis using Dun & Bradstreet sampling of small businesses having $20 million or less of sales or revenues. The data are weighted to be representative of U.S. small businesses within this size range nationwide.
In addition to sampling error, question wording and practical difficulties in conducting surveys can introduce error or bias into the findings of public opinion polls.
Interviews are conducted with respondents on landline telephones and cellular phones, with interviews conducted in Spanish for respondents who are primarily Spanish-speaking. Each sample includes a minimum quota of 400 cell phone respondents and 600 landline respondents per 1,000 national adults, with additional minimum quotas among landline respondents by region. Landline telephone numbers are chosen at random among listed telephone numbers. Cell phone numbers are selected using random-digit-dial methods. Landline respondents are chosen at random within each household on the basis of which member had the most recent birthday.
Samples are weighted by gender, age, race, Hispanic ethnicity, education, region, adults in the household, and phone status (cell phone only/landline only/both, cell phone mostly, and having an unlisted landline number). Demographic weighting targets are based on the March 2011 Current Population Survey figures for the aged 18 and older non-institutionalized population living in U.S. telephone households. All reported margins of sampling error include the computed design effects for weighting and sample design.
In addition to sampling error, question wording and practical difficulties in conducting surveys can introduce error or bias into the findings of public opinion polls.
For more details on Gallup's polling methodology, visit www.gallup.com.
