WASHINGTON, D.C. -- Gallup's U.S. Job Creation Index was at +19 in May, compared with +20 in April and +18 in March, providing a largely steady assessment of the U.S. job creation picture over the period in which the U.S. Bureau of Labor Statistics found job creation stalling.
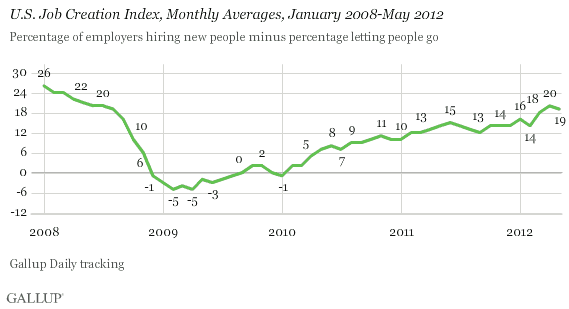
The results are based on interviews with 16,913 U.S. workers conducted from May 1-31 as part of Gallup Daily tracking. Gallup asks employed workers nationwide each day whether their employer is increasing, reducing, or maintaining the size of its workforce -- to provide a real-time indicator of the job creation climate. While Gallup's job creation measure does not capture the precise number of jobs that are being created or eliminated, it is a strong predictor of the direction of both U.S. jobless claims and U.S. unemployment, as reported by the U.S. Bureau of Labor Statistics.
The U.S. Job Creation Index score of +19 for May reflects 35% of workers nationwide saying their employers are hiring workers and expanding the size of their workforce, and 16% saying their employers are letting workers go and reducing the size of their workforce. The remaining 49% say their company is neither hiring nor firing or don't know. These percentages are very close to what workers reported in March and April, reflecting a steady, three-month trend of workers reporting more hiring than firing compared with what Gallup found in prior months since the global economic collapse.
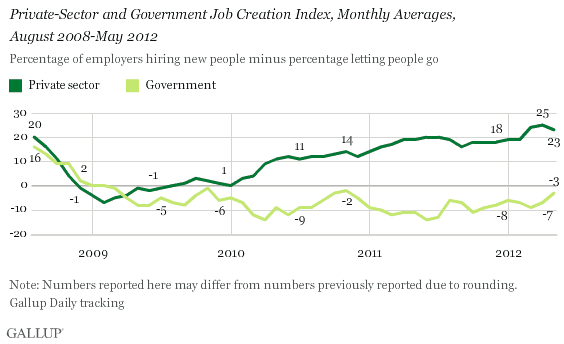
The steady nature of the nationwide picture obscures an uptick in net job creation in the government sector. While government job creation remains negative and well behind that of the private sector, the Job Creation Index score among government workers improved in May to -3 from -7 in April and -9 in March, with 27% of government workers reporting hiring at their place of work and 30% reporting firing.
Private-sector job creation remains far more robust, but fell slightly in May to +23, compared with +25 in April and +24 in March, with 37% of workers saying their employer is hiring and 14% saying their employer is letting workers go.
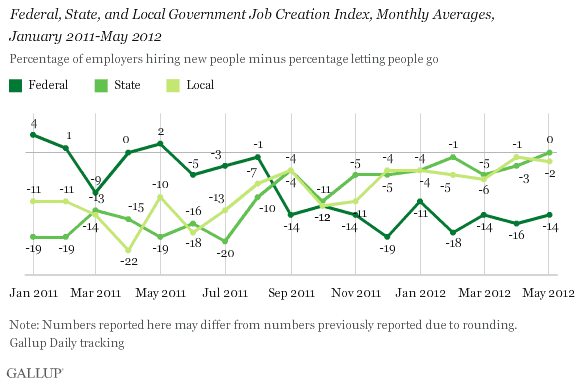
Within the government employment sector, the job creation situation improved at the state and federal levels. State job creation now threatens to break out of negative territory, with as many state government workers reporting hiring (27%) as report letting go (27%), for a Job Creation Index score of 0. The federal government, which until the middle of last year led state and local governments in terms of job creation, remains far behind both, with an index score of -14 for May.
Across regions, the job creation picture improved slightly in the Midwest in May, while deteriorating in the South and remaining largely steady in the East and West.
Implications
Gallup's job creation measure does not reveal a significant change in May versus April and March, a period over which the U.S. Bureau of Labor Statistics reported a significant slowdown in job creation compared with previous months. This means workers themselves did not perceive much change in hiring at their workplaces, even as the government found far fewer actual jobs being created.
Beneath the largely steady nationwide trend over the last three months, Gallup's measure reveals continued positive momentum in the Midwest and among state government workers. Overall, U.S. workers continue to report the best job creation conditions Gallup has recorded since the global economic collapse.
Gallup also finds U.S. economic confidence and consumer spending holding at higher rates over the past three months. Taken together, the Gallup findings suggest Americans' overall economic attitudes and behaviors remained slightly improved in March, April, and May, but did not get much better. Next month's reports will reveal whether the ill-received May jobs report has any negative impact.
Gallup.com reports results from these indexes in daily, weekly, and monthly averages and in Gallup.com stories. Complete trend data are always available to view and export in the following charts:
Daily: Employment, Economic Confidence, Job Creation, Consumer Spending
Weekly: Employment, Economic Confidence, Job Creation, Consumer Spending
Read more about Gallup's economic measures.
View our economic release schedule.
Survey Methods
Results are based on telephone interviews conducted as part of Gallup Daily tracking May 1-31, 2012, with a random sample of 16,913 adults, aged 18 and older, employed full or part time, living in all 50 U.S. states and the District of Columbia.
For results based on the total sample of employed adults, one can say with 95% confidence that the maximum margin of sampling error is ±1 percentage point.
Interviews are conducted with respondents on landline telephones and cellular phones, with interviews conducted in Spanish for respondents who are primarily Spanish-speaking. Each sample includes a minimum quota of 400 cell phone respondents and 600 landline respondents per 1,000 national adults, with additional minimum quotas among landline respondents by region. Landline telephone numbers are chosen at random among listed telephone numbers. Cell phone numbers are selected using random-digit-dial methods. Landline respondents are chosen at random within each household on the basis of which member had the most recent birthday.
Samples are weighted by gender, age, race, Hispanic ethnicity, education, region, adults in the household, and phone status (cell phone only/landline only/both, cell phone mostly, and having an unlisted landline number). Demographic weighting targets are based on the March 2011 Current Population Survey figures for the aged 18 and older non-institutionalized population living in U.S. telephone households. All reported margins of sampling error include the computed design effects for weighting and sample design.
In addition to sampling error, question wording and practical difficulties in conducting surveys can introduce error or bias into the findings of public opinion polls.
For more details on Gallup's polling methodology, visit www.gallup.com.
