WASHINGTON, D.C. -- Residents in the Pacific, Mountain, and West North Central regions of the U.S. are the most likely to say they learned something new yesterday and that their supervisor, if they work, treats them like a partner and not a boss. Their strong performance in these areas helps these regions rise to the top of a special Gallup analysis produced for Business Insider, which examined 13 forward-looking metrics that might determine which regions are poised for the brightest future.
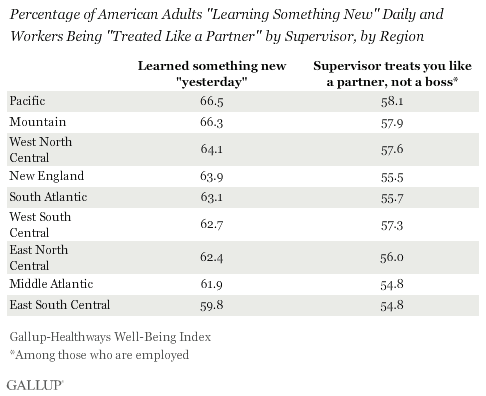
Learning something new and interesting daily is an important psychological need and one of the most prevalent attributes that people in communities with high wellbeing have in common. A key element in work environment wellbeing, being treated as a partner rather than as an underling lays a foundation for higher employee engagement and productivity, as well as better emotional and physical health.
These are two of 13 metrics encompassing economic, workplace, community, and personal choices Gallup used to assess the future livability of these nine U.S. regions. The findings are based on the results of nearly 480,000 interviews with U.S. adults conducted Jan. 2, 2011, through May 9, 2012, as a part of Gallup Daily tracking and the Gallup-Healthways Well-Being Index.
The West North Central region, which includes Minnesota, Iowa, Missouri, North Dakota, South Dakota, Nebraska, and Kansas, did best overall, buoyed by the highest percentage of workers employed in full-time jobs with an employer and the best Job Creation Index score in the country. See the table on page 2 for the complete list of metrics and results.
Pacific, Mountain Regions Score Well on Health
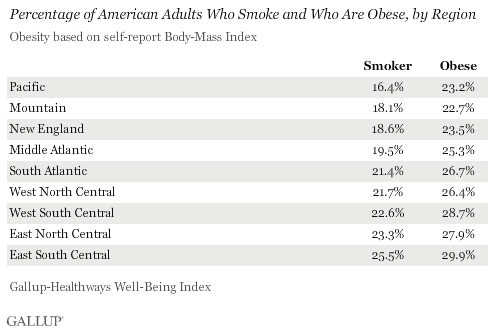
The Pacific region -- composed of California, Oregon, Washington, Hawaii, and Alaska -- and the Mountain region -- which includes Montana, Arizona, Colorado, Idaho, Wyoming, Utah, Nevada, and New Mexico -- also share another advantage: their residents tend to be healthier. These regions share the lowest rates of smoking and obesity in the country. Here, the West North Central region does not do as well, indicating its leading position today could be in jeopardy if the region's smoking and obesity rates begin to negatively affect the region in terms of healthcare costs or productivity.
West South Central Region Leads in Positive Momentum
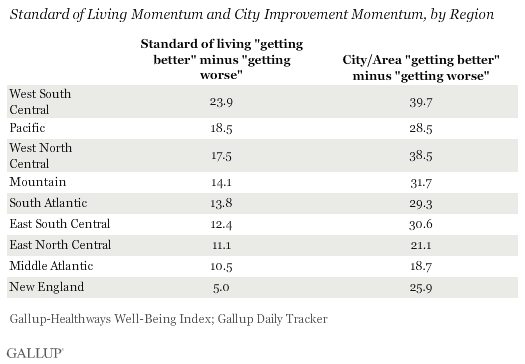
Residents in the West South Central region -- made up of Arkansas, Louisiana, Texas, and Oklahoma -- express the most positivity about their standard of living and their communities looking forward. Residents here are much more likely than those in other regions to say that both their standard of living and their community as a place to live are getting better rather than getting worse. The Pacific, West North Central, and Mountain regions round out the top four on both of these measures.
The East South Central Region Faces the Most Challenges
The East South Central region, which includes Kentucky, Tennessee, Alabama, and Mississippi, trails on several of these crucial metrics, performing the worst of the nine regions tested overall.
People in this region are the least likely to be employed full time for an employer and to learn new and interesting things daily. They are also the most likely nationwide to be obese, to smoke, and to say it is not easy for them to find a safe place to exercise.
Read the full analysis at Business Insider and learn more about what the regions can do to turn these metrics around this July in the Gallup Business Journal.
Survey Methods
Results are based on telephone interviews conducted as part of Gallup Daily tracking/the Gallup Healthways Well-Being Index survey, Jan. 2, 2011 through May 9, 2012, with a random sample of 479,674 adults, aged 18 and older, living in all 50 U.S. states and the District of Columbia. Sample sizes for each region are as shown:
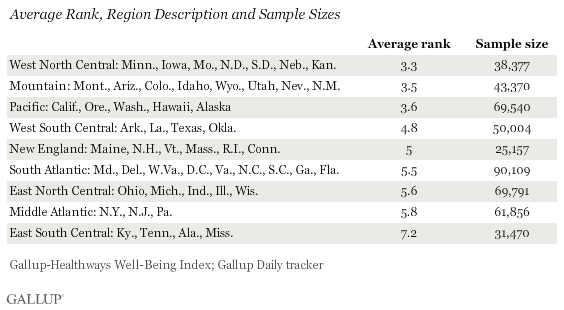
For results based on each regional sample, one can say with 95% confidence that the maximum margin of sampling error is ±0.7 percentage points.
Interviews are conducted with respondents on landline telephones and cellular phones, with interviews conducted in Spanish for respondents who are primarily Spanish-speaking. Each sample includes a minimum quota of 400 cell phone respondents and 600 landline respondents per 1,000 national adults, with additional minimum quotas among landline respondents by region. Landline telephone numbers are chosen at random among listed telephone numbers. Cell phones numbers are selected using random digit dial methods. Landline respondents are chosen at random within each household on the basis of which member had the most recent birthday.
Samples are weighted by gender, age, race, Hispanic ethnicity, education, region, adults in the household, and phone status (cell phone-only/landline only/both, cell phone mostly, and having an unlisted landline number). Demographic weighting targets are based on the March 2011 Current Population Survey figures for the aged 18 and older non-institutionalized population living in U.S. telephone households. All reported margins of sampling error include the computed design effects for weighting and sample design.
[The Standard of Living question reported here was asked of a random half-sample of respondents for the same period on the Gallup Daily tracking survey.]
In addition to sampling error, question wording and practical difficulties in conducting surveys can introduce error or bias into the findings of public opinion polls.
[Polls conducted entirely in one day, such as this one, are subject to additional error or bias not found in polls conducted over several days.]
For more details on Gallup's polling methodology, visit www.gallup.com.
