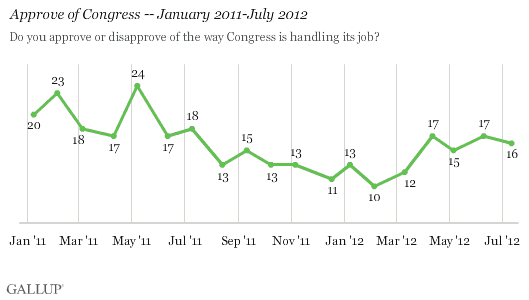
PRINCETON, NJ -- Americans' view of the job Congress is doing is holding at roughly the same level Gallup has found since April, with 16% approving and 78% disapproving. This is slightly improved from the record low of 10% seen in February and similar to the ratings in mid-2011, but below where it stood at the start of that year.

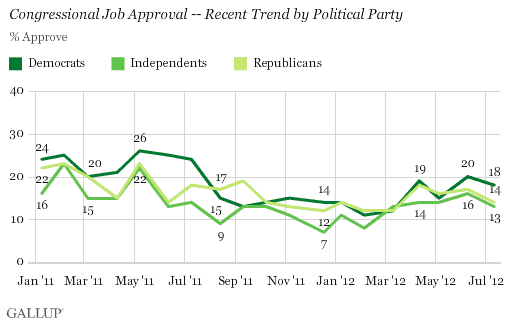
Congressional approval by party is also largely unchanged, with Democrats (18%) slightly more likely to approve than Republicans (14%) and independents (13%), as was the case in June. For most of the past year, however, Republicans' and Democrats' approval of Congress has been similar, with independents' approval tending to be slightly lower.

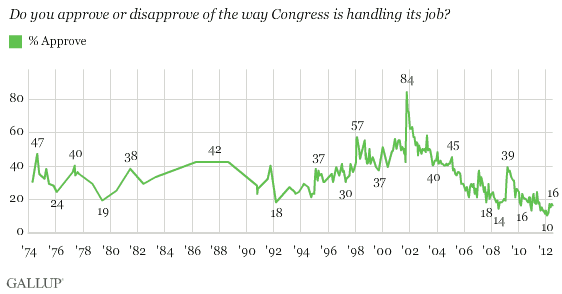
With only four months remaining until the November elections, it bears repeating that Congress approval remains on the extreme low end of the historical range Gallup has recorded since 1974.
From 1974 through 2004, Congress' job approval averaged just over 40%, with most of the readings falling within 10 percentage points of that average, and only two readings below 20% -- one in 1979 and the other in 1992. Then, in February 2005, approval fell below 40% and has not since returned to that level in any of Gallup's monthly readings.
Approval rose to 39% at the start of Barack Obama's presidency in 2009, but subsequently dropped, and since 2010 has averaged 17%, with most of the readings falling below 20%.

Bottom Line
At 16%, Congress' job approval rating is similar to the average 17% seen since the start of 2010 -- an extremely low level historically. Apart from any criticism Americans may have of Congress for its recent legislative actions or inaction, the continued negative economic climate is likely a major reason for the low ratings, something Gallup has demonstrated previously. However, with control of the houses divided between the parties, and Republicans and Democrats since mid-2011 tending to express equally low approval of Congress, it is unclear whether either party will suffer disproportionately at the polls.
Survey Methods
Results for this Gallup poll are based on telephone interviews conducted July 9-12, 2012, with a random sample of 1,014 adults, aged 18 and older, living in all 50 U.S. states and the District of Columbia.
For results based on the total sample of national adults, one can say with 95% confidence that the maximum margin of sampling error is ±4 percentage points.
Interviews are conducted with respondents on landline telephones and cellular phones, with interviews conducted in Spanish for respondents who are primarily Spanish-speaking. Each sample includes a minimum quota of 400 cell phone respondents and 600 landline respondents per 1,000 national adults, with additional minimum quotas among landline respondents by region. Landline telephone numbers are chosen at random among listed telephone numbers. Cell phone numbers are selected using random-digit-dial methods. Landline respondents are chosen at random within each household on the basis of which member had the most recent birthday.
Samples are weighted by gender, age, race, Hispanic ethnicity, education, region, adults in the household, and phone status (cell phone only/landline only/both, cell phone mostly, and having an unlisted landline number). Demographic weighting targets are based on the March 2011 Current Population Survey figures for the aged 18 and older non-institutionalized population living in U.S. telephone households. All reported margins of sampling error include the computed design effects for weighting and sample design.
In addition to sampling error, question wording and practical difficulties in conducting surveys can introduce error or bias into the findings of public opinion polls.
View methodology, full question results, and trend data.
For more details on Gallup's polling methodology, visit www.gallup.com.
