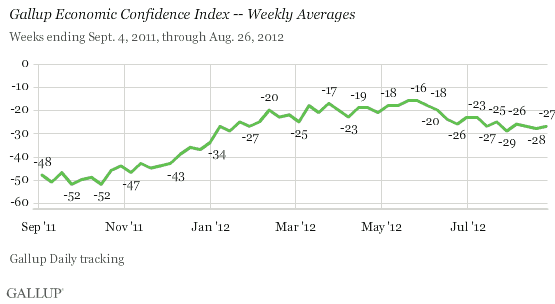
WASHINGTON, D.C. -- Americans' views of the economy remain entrenched in negative territory as both Mitt Romney and Barack Obama prepare to use their respective conventions to make the case that they are the one better equipped to improve the country's economic situation. The Gallup Economic Confidence Index was at -27 for the week ending Aug. 26, similar to the -28 of the previous week and on par with what Gallup has found over the past seven weeks.

The latest weekly average in Gallup 's daily economic confidence metric sets the stage for the two political conventions in which Republicans and Democrats will battle over whether the economy has improved -- and, further, whether it is poised to get better or worse.
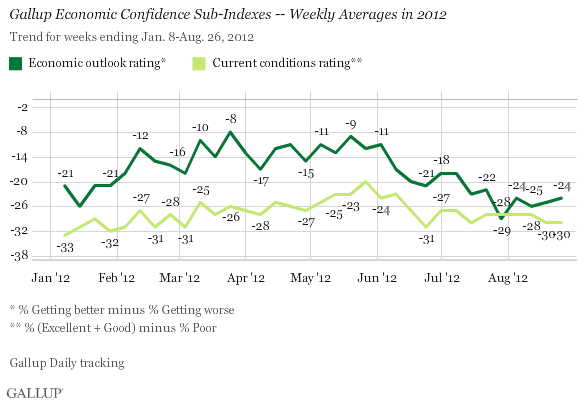
Currently, 43% of Americans say economic conditions are "poor," while 13% categorize them as "excellent" (1%) or "good" (12%). The difference results in a current conditions rating of -30, unchanged from the prior week and similar to recent weeks. The remaining 44% call current conditions "only fair."
Looking forward, 59% of Americans perceive the economy to be getting worse, while 35% say it is getting better. The difference results in an economic outlook rating of -24, similar to previous weeks.
From a broader perspective, Americans have been consistently more negative about the economy both now and going forward since June, compared with March through May. Weekly confidence continues to mirror the general levels seen in January.

Politics Clouds Americans' Economic Lenses
Gallup has consistently found wide gaps in economic confidence by political party this year, and the conventions could cause the party differences to expand further. Democrats remain far more positive than Republicans, and this divide could widen as Republicans will undoubtedly paint a negative picture of the economy while the Democrats present a rosier view. In the week ending Aug. 26, Democrats became slightly more positive, but the improvement in their views was mostly offset by independents' increase in negativity. Republicans' views were essentially unchanged from the previous week.

Bottom Line
U.S. economic confidence has been largely entrenched at the same level for the past seven weeks -- echoing the steady nature of President Obama's job approval rating and presidential preferences between Obama and Republican challenger Mitt Romney. While the race itself may be primed for a shake-up, Americans may continue to vacillate on their views of the economy until they know which party's standard-bearer will take the helm next January. At the same time, the conventions could make Democrats more positive about the economy in the near term and Republicans more negative. Those shifts could easily cancel each other out unless one party makes particular headway with independents.
Gallup Daily tracking of economic confidence ratings among Americans and by party will reveal any measurable shifts that take place in the coming weeks.
Gallup.com reports results from these indexes in daily, weekly, and monthly averages and in Gallup.com stories. Complete trend data are always available to view and export in the following charts:
Daily: Employment, Economic Confidence, Job Creation, Consumer Spending
Weekly: Employment, Economic Confidence, Job Creation, Consumer Spending
Read more about Gallup's economic measures.
View our economic release schedule.
Survey Methods
Results are based on telephone interviews conducted as part of Gallup Daily tracking from Aug. 20-26, 2012, with a random sample of 3,379 adults, aged 18 and older, living in all 50 U.S. states and the District of Columbia, selected using random-digit-dial sampling.
For results based on the total sample of national adults, one can say with 95% confidence that the maximum margin of sampling error is ±2 percentage points.
Interviews are conducted with respondents on landline telephones and cellular phones, with interviews conducted in Spanish for respondents who are primarily Spanish-speaking. Each sample includes a minimum quota of 400 cell phone respondents and 600 landline respondents per 1,000 national adults, with additional minimum quotas among landline respondents by region. Landline telephone numbers are chosen at random among listed telephone numbers. Cell phone numbers are selected using random-digit-dial methods. Landline respondents are chosen at random within each household on the basis of which member had the most recent birthday.
Samples are weighted by gender, age, race, Hispanic ethnicity, education, region, adults in the household, and phone status (cell phone only/landline only/both, cell phone mostly, and having an unlisted landline number). Demographic weighting targets are based on the March 2011 Current Population Survey figures for the aged 18 and older non-institutionalized population living in U.S. telephone households. All reported margins of sampling error include the computed design effects for weighting and sample design.
In addition to sampling error, question wording and practical difficulties in conducting surveys can introduce error or bias into the findings of public opinion polls.
For more details on Gallup's polling methodology, visit www.gallup.com.
