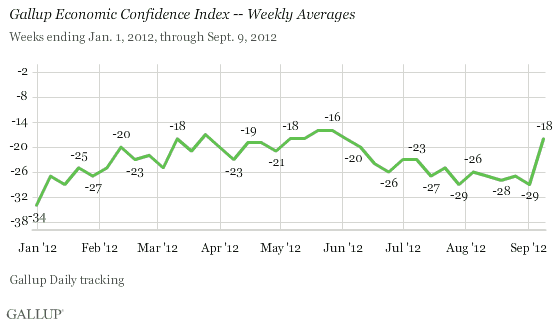
PRINCETON, NJ -- The U.S. Gallup Economic Confidence Index surged to -18 for the week ending Sept. 9, up 11 points from -29 the prior week. This puts the index near the high point for the year after 2 ½ months when, weighed down by continued high unemployment, the index had languished well below -20.

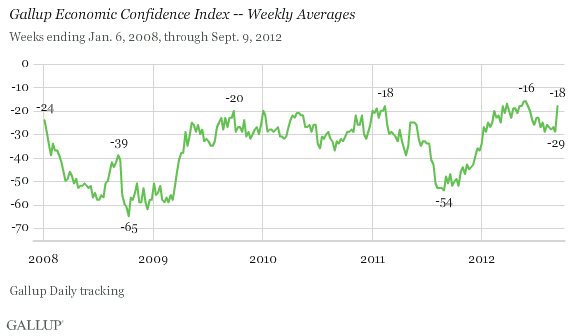
At -18, the index is also on par with the highest levels seen since the start of Gallup Daily tracking in January 2008, although this has proved a difficult barrier for the index to break. The index has reached -16 or -17 just a handful of times in weekly averages, only to quickly recede.
Last week's 11-point jump is also the biggest one-week improvement in the Gallup Economic Confidence Index since its inception, although it roughly matches the 10-point gain that occurred the week after the killing of Osama bin Laden in May 2011.
The biggest weekly change of any kind in the index was the 15-point decline that occurred at the start of the U.S. financial crisis in September 2008.

Democratic National Convention Moves Consumers
It appears that the spark for the dramatic rise in Americans' economic confidence last week was the Democratic National Convention. A review of Gallup's nightly tracking results shows that the index was consistently near or below -25 each night in late August and early September, but then sharply improved on Sept. 4, the first night of the convention, to -18.
Confidence then held at or near -18 through Sunday, despite the U.S. Bureau of Labor Statistics' mixed August unemployment report Friday morning showing continued weak jobs growth.
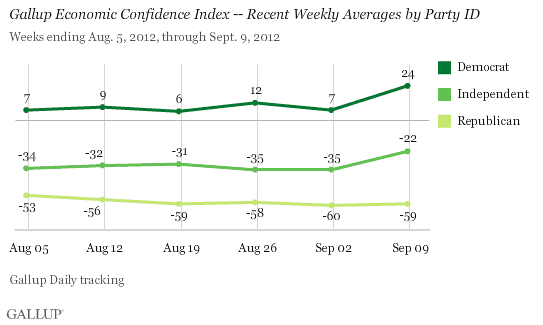
More specifically, the convention appears to have given Democrats and, to a lesser degree, independents, fresh optimism about the economy. Democrats' confidence for the week spanning the convention averaged +24, up 17 points from +7 the prior week. Confidence was up 13 points among independents, but was virtually unchanged among Republicans.

There was no comparable shift in Americans' views of the economy, either overall or by party, during the prior week spanning the Republican National Convention.
Bottom Line
While television ratings for most nights of this year's presidential conventions were down from 2008, enough coverage of the Democrats' convention may have filtered through to the party faithful and independents -- particularly online and through social media -- to generate improved confidence in the economy under President Obama's stewardship. This could reflect renewed confidence in the economy per se, or heightened enthusiasm for the Democratic Party generally.
It remains to be seen whether the gains made last week will carry into the fall, or whether -18 will again prove an impenetrable boundary for the Gallup Economic Confidence Index to surpass, at least by much, as long as the nation's employment picture remains weak.
Gallup.com reports results from these indexes in daily, weekly, and monthly averages and in Gallup.com stories. Complete trend data are always available to view and export in the following charts:
Daily: Employment, Economic Confidence, Job Creation, Consumer Spending
Weekly: Employment, Economic Confidence, Job Creation, Consumer Spending
Read more about Gallup's economic measures.
View our economic release schedule.
Survey Methods
Results are based on telephone interviews conducted as part of Gallup Daily tracking Sept. 3-9, 2012, with a random sample of 3,330 adults, aged 18 and older, living in all 50 U.S. states and the District of Columbia.
For results based on the total sample of national adults, one can say with 95% confidence that the maximum margin of sampling error is ±2 percentage points.
Interviews are conducted with respondents on landline telephones and cellular phones, with interviews conducted in Spanish for respondents who are primarily Spanish-speaking. Each sample includes a minimum quota of 400 cell phone respondents and 600 landline respondents per 1,000 national adults, with additional minimum quotas among landline respondents by region. Landline telephone numbers are chosen at random among listed telephone numbers. Cell phone numbers are selected using random-digit-dial methods. Landline respondents are chosen at random within each household on the basis of which member had the most recent birthday.
Samples are weighted by gender, age, race, Hispanic ethnicity, education, region, adults in the household, and phone status (cell phone only/landline only/both, cell phone mostly, and having an unlisted landline number). Demographic weighting targets are based on the March 2011 Current Population Survey figures for the aged 18 and older non-institutionalized population living in U.S. telephone households. All reported margins of sampling error include the computed design effects for weighting and sample design.
In addition to sampling error, question wording and practical difficulties in conducting surveys can introduce error or bias into the findings of public opinion polls.
For more details on Gallup's polling methodology, visit www.gallup.com.
