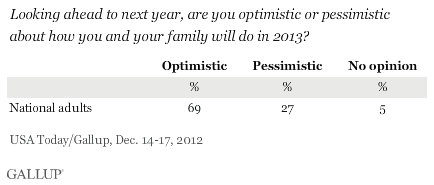
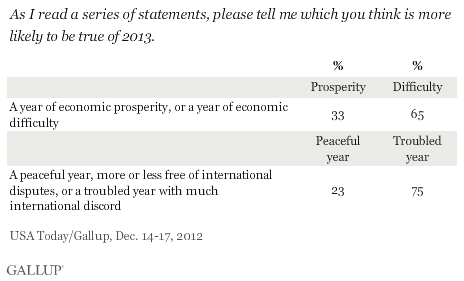
PRINCETON, NJ -- Although Americans are generally pessimistic about the prospects for the nation's economy and international peace in the year ahead, the large majority (69%) say they are optimistic about how they and their family will do in 2013, while 27% are pessimistic.

As is usually the case, Americans are much more positive when asked to reflect on their own personal situation than when asked about the broader situation across the country. Gallup previously reported on Americans' negativity about the prospects for the U.S. economy and the international situation in 2013. The 69% of Americans who are personally optimistic about 2013 contrasts with the 33% who say that 2013 will be a year of economic prosperity, and the 23% who say 2013 will be a year of international peace.

Democrats, Liberals Most Positive
Americans' personal optimism about 2013 is related to their political and ideological orientation. Democrats and liberals are the most personally optimistic about the coming year, while Republicans and conservatives are the least. This pattern is not unusual. Gallup research has shown that Democrats are the most positive about the economy in general and are the most likely to say that the best years for the U.S. are ahead of us, rather than behind. Still, Americans of all political and ideological persuasions are at least slightly more likely to say they are optimistic than pessimistic about their personal situation in the coming year.

Younger Americans Most Personally Optimistic About 2013
Personal optimism about 2013 varies across major demographic and regional categories, although in some cases not as much as might be expected:
- There is little significant difference in personal optimism across socioeconomic segments of the population, perhaps surprisingly. Those with higher levels of education and higher incomes are generally no more optimistic than those with lower socioeconomic status.
- Optimism declines with age, ranging from 80% of 18- to 29-year-olds who are optimistic about their personal situation in 2013 to 54% of those aged 65 and older.
- Women are slightly more optimistic than men.
- Easterners and Westerners are modestly more optimistic than those living in the South and in the Midwest.
- Nonwhites are more optimistic than whites.

Bottom Line
Americans remain positive when they are asked about their personal situation in 2013, a sentiment that stands in sharp contrast to their more negative prognostications when asked about the economy in general or the international situation in the coming year. The impact of politics is seen even in these personal attitudes, with Democrats reporting a significantly higher level of optimism than Republicans.
Survey Methods
Results for this USA Today/Gallup poll are based on telephone interviews conducted Dec. 14-17, 2012, with a random sample of 1,025 adults, aged 18 and older, living in all 50 U.S. states and the District of Columbia.
For results based on the total sample of national adults, one can say with 95% confidence that the maximum margin of sampling error is ±4 percentage points.
Interviews are conducted with respondents on landline telephones and cellular phones, with interviews conducted in Spanish for respondents who are primarily Spanish-speaking. Each sample includes a minimum quota of 400 cellphone respondents and 600 landline respondents per 1,000 national adults, with additional minimum quotas among landline respondents by region. Landline telephone numbers are chosen at random among listed telephone numbers. Cellphone numbers are selected using random-digit-dial methods. Landline respondents are chosen at random within each household on the basis of which member had the most recent birthday.
Samples are weighted by gender, age, race, Hispanic ethnicity, education, region, adults in the household, population density, and phone status (cellphone only/landline only/both, cellphone mostly, and having an unlisted landline number). Demographic weighting targets are based on the March 2011 Current Population Survey figures for the aged 18 and older U.S. population. All reported margins of sampling error include the computed design effects for weighting.
In addition to sampling error, question wording and practical difficulties in conducting surveys can introduce error or bias into the findings of public opinion polls.
View methodology, full question results, and trend data.
For more details on Gallup's polling methodology, visit https://www.gallup.com/.
