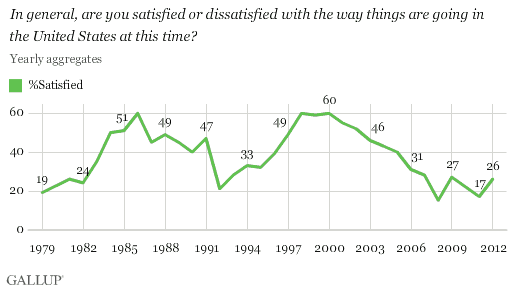
PRINCETON, NJ -- An average of 26% of Americans said they were satisfied with the way things were going in the United States in 2012, an improvement from 17% in 2011. Still, satisfaction remains depressed compared with the historical average of 38%.

The 2011 average of 17% satisfaction was one of the lowest in Gallup records dating back to 1979, with only a 15% average from 2008 lower. The highest yearly averages were 60% in 1998 and 2000. Satisfaction has averaged below 30% each year since 2007.
Gallup asks Americans about satisfaction monthly and reported 14 separate measurements in 2012, ranging from a low of 18% in January to a high of 33% in November. Satisfaction had generally shown improvement, particularly in the fall months when it was at or exceeded 30% from September through mid-November, before falling back to 23% in December.

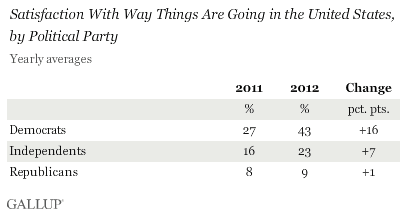
On average, Democrats (43%) were much more satisfied than Republicans (9%) or independents (23%) in 2012. Democratic satisfaction averaged an even higher 55% from September through November, coinciding with President Obama's fall re-election campaign.
Democrats were primarily responsible for the increase in satisfaction from 2011 to 2012, but independents were also modestly more satisfied.

One major reason satisfaction likely improved from 2011 to 2012 was Americans' more positive assessment of the national economy. Gallup's Economic Confidence Index also showed significant improvement in 2012 compared with 2011.
Implications
Americans were a bit more positive about national conditions in 2012 than they were in 2011, though on an absolute basis still not very satisfied. Satisfaction has been in a slump for several years now, with levels below the historical average each of the last seven years. This, however, did not prevent President Obama from being re-elected, with the lowest average satisfaction level in a year an incumbent successfully won re-election.
One key to breaking out of that slump is to sustain some positive momentum in satisfaction. After dropping to a historical low of 15% in 2008, satisfaction rebounded to 27% in 2009, President Obama's first year in office. But satisfaction declined in both of the following years, before improving again last year.
Perceptions of national economic conditions will be an important factor in determining whether satisfaction continues to improve in 2013. The economy has certainly improved in many respects compared with the 2008-2009 recession, but some aspects of the economy, such as unemployment, remain problematic and serve as a drag on Americans' mood.
Survey Methods
Results for this Gallup poll are based on telephone interviews conducted in 14 separate Gallup polls January-December 2012, each with a random sample of approximately 1,000 adults, aged 18 and older, living in all 50 U.S. states and the District of Columbia, selected using random-digit-dial sampling.
For results based on the total combined sample of national adults, one can say with 95% confidence that the maximum margin of sampling error is ±1 percentage point.
Interviews are conducted with respondents on landline telephones and cellular phones, with interviews conducted in Spanish for respondents who are primarily Spanish-speaking. Each sample includes a minimum quota of 400 cellphone respondents and 600 landline respondents per 1,000 national adults, with additional minimum quotas among landline respondents by region. Landline telephone numbers are chosen at random among listed telephone numbers. Cellphone numbers are selected using random-digit-dial methods. Landline respondents are chosen at random within each household on the basis of which member had the most recent birthday.
Samples are weighted by gender, age, race, Hispanic ethnicity, education, region, adults in the household, and phone status (cellphone only/landline only/both, cellphone mostly, and having an unlisted landline number). Demographic weighting targets are based on the March 2011 Current Population Survey figures for the aged 18 and older non-institutionalized population living in U.S. telephone households. All reported margins of sampling error include the computed design effects for weighting and sample design.
In addition to sampling error, question wording and practical difficulties in conducting surveys can introduce error or bias into the findings of public opinion polls.
For more details on Gallup's polling methodology, visit https://www.gallup.com/.
