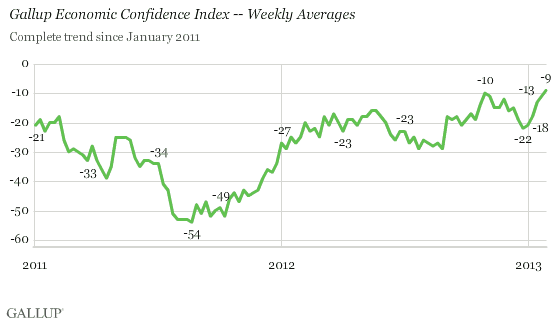
WASHINGTON, D.C. -- Americans were more positive about the economy last week than they have been at any time since Gallup began tracking economic confidence daily in January 2008. Gallup's Economic Confidence Index improved to -9, from -13 the prior week and -22 during the last week of December. This just beats the previous weekly high of -10 set during the week ending Nov. 4, just before the U.S. presidential election.

The current weekly average spanning Jan. 21-27, 2013, reflects the continuation of an upward climb that has been ongoing throughout January, as major U.S. stock markets have also soared past five-year highs.
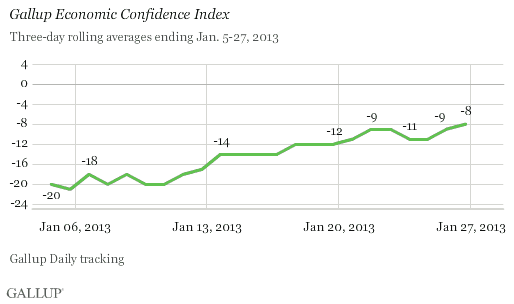
Gallup's daily three-day rolling averages show economic confidence improving significantly since the start of the month. The -8 score for Jan. 25-27 is the second highest in Gallup's complete daily trend since January 2008, behind only the -7 recorded Nov. 6-8, 2012, during and just after the U.S. presidential election.

Gallup's Economic Confidence Index has not entered positive territory since Gallup began tracking it daily in 2008. If and when that happens, it will mark the first time since the recession and global economic collapse that Americans on average are more positive than negative about the U.S. economy. Gallup did see that happen at times prior to 2008, when it asked about economic confidence on a less frequent basis.
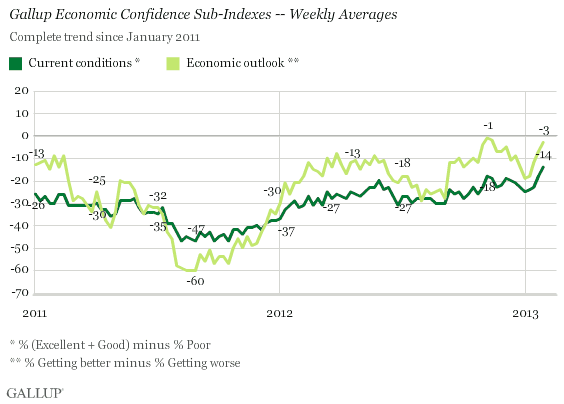
Americans' views about the economy going forward are poised to cross this threshold first. Last week, 46% of Americans said the economy is getting better while 49% said it is getting worse, for a net score of -3. This is improved from -7 the prior week and -19 during the last week of December.
Americans' views of current economic conditions trail slightly but have improved at a similar pace. Last week, 19% of Americans said the current economic conditions are excellent or good and 33% said they are poor, for a net score of -14. This is improved from -18 the prior week and -25 the last week of December.

Implications
Americans' current views of the U.S. economy clearly indicate a new wave of optimism during the start of 2013. Americans are now more positive about the economy -- taking into account current conditions and the outlook for the future -- than at any time since the recession and global financial crisis. This likely reflects a combination of factors, including the recent surge in U.S. stock markets, Democrats' becoming more confident about the economy after the U.S. presidential election, and the lifting of the uncertainty that surrounded the election and the fiscal cliff budget negotiations toward the end of 2012.
Gallup's continued daily tracking of U.S. economic confidence will document whether Americans continue to grow more positive this year or whether this is a short-lived bump after the start of a new year and the start of a new presidential term only to be later erased.
Gallup.com reports results from these indexes in daily, weekly, and monthly averages and in Gallup.com stories. Complete trend data are always available to view and export in the following charts:
Daily: Employment, Economic Confidence, Job Creation, Consumer Spending
Weekly: Employment, Economic Confidence, Job Creation, Consumer Spending
Read more about Gallup's economic measures.
View our economic release schedule.
Survey Methods
Results are based on telephone interviews conducted as part of Gallup Daily tracking Jan. 21-27, 2013, with a random sample of 3,546 adults, aged 18 and older, living in all 50 U.S. states and the District of Columbia.
For results based on the total sample of national adults, one can say with 95% confidence that the maximum margin of sampling error is ±2 percentage points.
Interviews are conducted with respondents on landline telephones and cellular phones, with interviews conducted in Spanish for respondents who are primarily Spanish-speaking. Each sample of national adults includes a minimum quota of 50% cell phone respondents and 50% landline respondents, with additional minimum quotas by region. Landline telephone numbers are chosen at random among listed telephone numbers. Cell phones numbers are selected using random digit dial methods. Landline respondents are chosen at random within each household on the basis of which member had the most recent birthday.
Samples are weighted to correct for unequal selection probability, nonresponse, and double coverage of landline and cell users in the two sampling frames. They are also weighted to match the national demographics of gender, age, race, Hispanic ethnicity, education, region, population density, and phone status (cellphone only/landline only/both, cellphone mostly, and having an unlisted landline number). Demographic weighting targets are based on the March 2012 Current Population Survey figures for the aged 18 and older U.S. population. Phone status targets are based on the July-December 2011 National Health Interview Survey. Population density targets are based on the 2010 census. All reported margins of sampling error include the computed design effects for weighting.
In addition to sampling error, question wording and practical difficulties in conducting surveys can introduce error or bias into the findings of public opinion polls.
For more details on Gallup's polling methodology, visit www.gallup.com.
