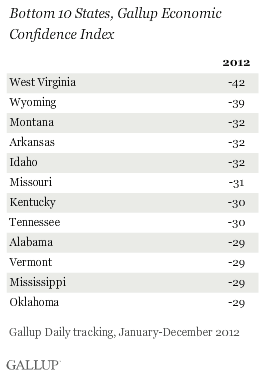
PRINCETON, NJ -- Economic confidence improved in most states last year. However, the Gallup Economic Confidence Index remained negative in all 50 states in 2012, while it turned positive in the District of Columbia. After the nation's capital, the index registered its highest averages in Minnesota, Hawaii, Maryland, and Iowa. It was lowest in West Virginia, followed by Wyoming.


Most of the top 10 states in economic confidence are the same as in 2011, with some shifts in order; however, Texas, Virginia, and Washington are new this year. Of the bottom 10, only West Virginia, Mississippi, Montana, and Idaho are repeats from 2011.
These results are based on Gallup Daily tracking interviews with nearly 175,000 national adults, conducted from January through December 2012, and thus represent averages for the year.
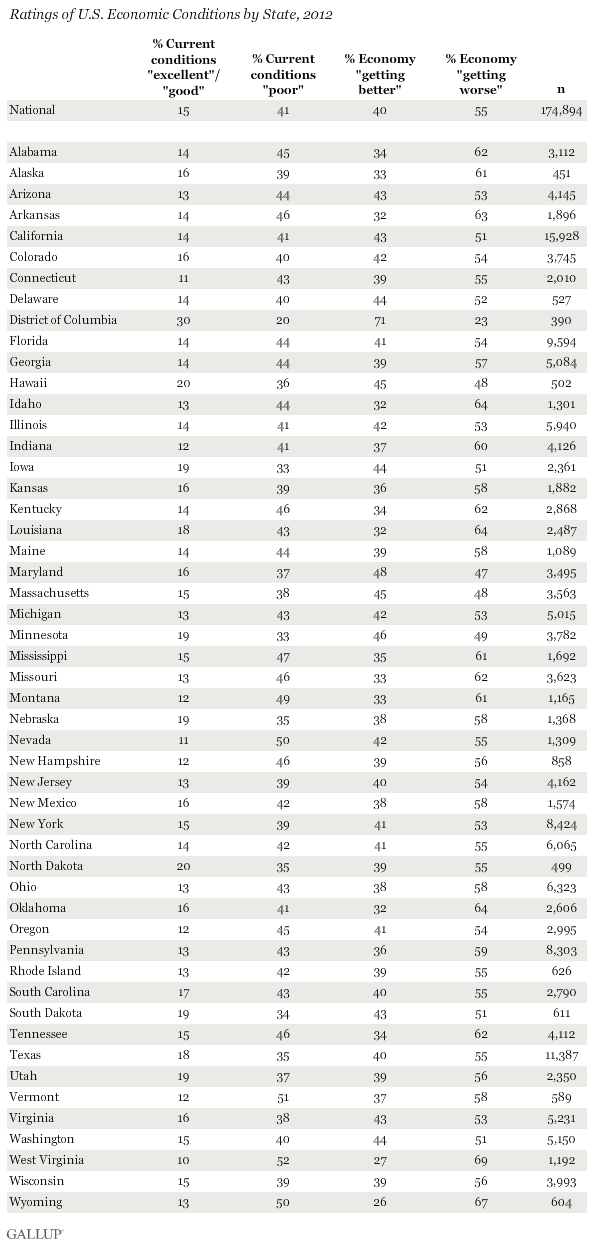
The Gallup Economic Confidence Index is a composite of Americans' ratings of current U.S. economic conditions and their perceptions of the economy's direction. The index has a theoretical maximum of +100 (if all respondents rate the economy "excellent" or "good" and say it is getting better) and a theoretical minimum of -100 (if all rate the economy "poor" and say it is getting worse). Full state-level results for these index components can be found on page 2.
National Improvement Reflected in Most States
The Gallup Economic Confidence Index averaged -21 nationally in 2012, up 16 points from -37 in 2011. The 2012 figure includes several months of improving confidence at the start of the year, followed by a slump over the summer and renewed confidence in the fall.
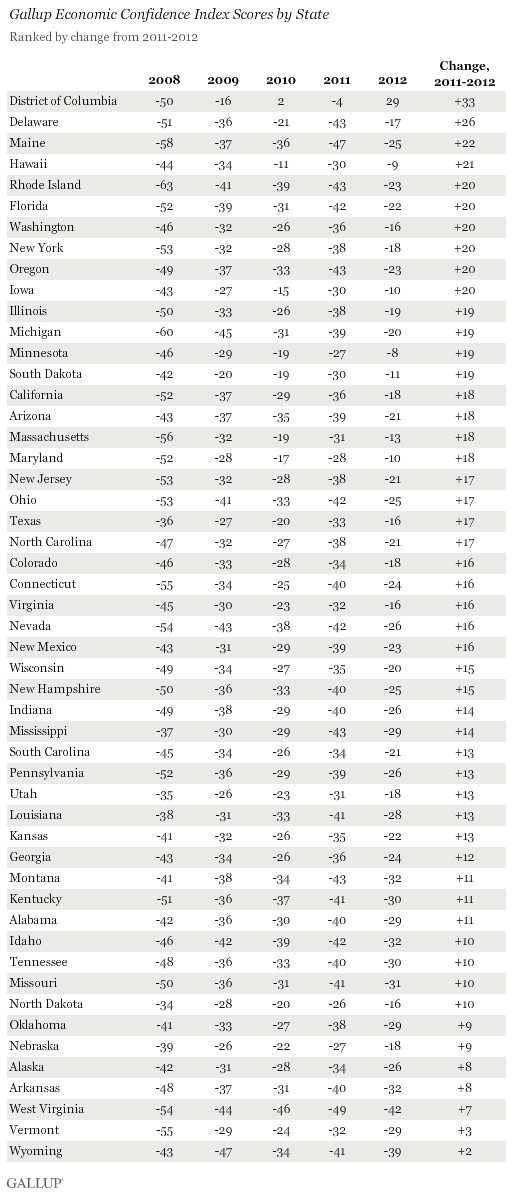
Improvement in the overall index last year helped push Minnesota (-8) and Hawaii (-9) to within 10 points of the neutral, zero mark on the index scale -- the first time since Gallup initiated daily tracking in 2008 that confidence has been this close to crossing into positive territory in any of the 50 states.
Other states scoring significantly above average were Maryland, Iowa, South Dakota, and Massachusetts. Notably, all of these above-average states except Iowa and South Dakota lean Democratic politically, and gave President Barack Obama above-average job approval ratings in 2012, thus highlighting the somewhat political nature of economic confidence attitudes.
The states with substantially lower-than-average economic confidence scores last year include Montana, Arkansas, Idaho, Missouri, Kentucky, and Tennessee, in addition to the aforementioned West Virginia and Wyoming. Not only are these states all located in the Southern, Midwestern, or Western regions of the country, but they had below-average approval of President Barack Obama in 2012.
Gallup has long observed that economic confidence is a complex consumer attitude that reflects real-world economic factors, but is also sensitive to the U.S. political environment, with members of the current president's party typically expressing more confidence than members of the opposing party. Thus, with a Democrat in the White House since 2009, Democrats' economic confidence has been significantly higher than Republicans'.
Forty-Eight of 50 States Gain in Economic Confidence
Economic confidence improved by a statistically significant margin in 48 states plus the District of Columbia in 2012, but not in Wyoming or Vermont. However, there was a wide range of improvement, with the greatest gains -- 20 percentage points or more -- occurring in the District of Columbia, Delaware, Maine, Hawaii, Rhode Island, Florida, Washington state, New York, Oregon, and Iowa.
Gains similar to the average 16-point increase seen nationally were made in a variety of states, including Connecticut, Virginia, Nevada, New Mexico, Texas, Colorado, Wisconsin, and New Hampshire.
States showing minimal, but still statistically significant, gains of less than 10 percentage points include West Virginia, Arkansas, Alaska, Nebraska, and Oklahoma.

Bottom Line
Americans' confidence in the U.S. economy improved not only on a national basis in 2012, but in most of the states. However, the wide range in improvement -- from small gains in West Virginia, Arkansas, and Alaska, to better than 20-point gains in Delaware, Maine, and Hawaii -- suggests that perceptions of national conditions can be influenced by local or regional economic conditions as well as possibly biased by political sensibilities.
Gallup's "State of the States" series reveals state-by-state differences on political, economic, and well-being measures Gallup tracks each day. New stories based on full-year 2012 data will be released throughout the month of February.
Gallup.com reports results from these indexes in daily, weekly, and monthly averages and in Gallup.com stories. Complete trend data are always available to view and export in the following charts:
Daily: Employment, Economic Confidence, Job Creation, Consumer Spending
Weekly: Employment, Economic Confidence, Job Creation, Consumer Spending
Read more about Gallup's economic measures.
View our economic release schedule.
Survey Methods
Results are based on telephone interviews conducted as part of Gallup Daily tracking Jan. 1-Dec. 31, 2012, with a random sample of 174,894 adults, aged 18 and older, living in all 50 U.S. states and the District of Columbia.
For results based on the total sample of national adults, one can say with 95% confidence that the maximum margin of sampling error is ±1 percentage point.
Margins of error for individual states are no greater than ±6 percentage points, and are ±3 percentage points in most states. The margin of error for the District of Columbia is ±6 percentage points.
Interviews are conducted with respondents on landline telephones and cellular phones, with interviews conducted in Spanish for respondents who are primarily Spanish-speaking. Each national sample includes a minimum quota of 400 cell phone respondents and 600 landline respondents per 1,000 national adults, with additional minimum quotas among landline respondents by region. Landline telephone numbers are chosen at random among listed telephone numbers. Cell phones numbers are selected using random digit dial methods. Landline respondents are chosen at random within each household on the basis of which member had the most recent birthday.
State samples are weighted to be representative of the state's adult population by gender, age, race, Hispanic ethnicity, and education, region based on the March 2012 Current Population Survey. All reported margins of sampling error include the computed design effects for weighting.
The questions here were asked of a random half-sample of respondents each day on the Gallup Daily tracking survey.
In addition to sampling error, question wording and practical difficulties in conducting surveys can introduce error or bias into the findings of public opinion polls.
For more details on Gallup's polling methodology, visit www.gallup.com.

