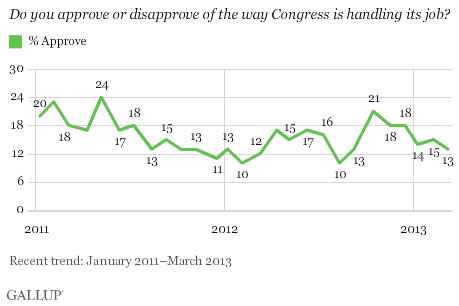
PRINCETON, NJ -- The budget sequestration that went into effect on March 1 appears to have had little impact on Americans' views of Congress. Thirteen percent of Americans approve of Congress in March, essentially unchanged from 15% in February.

One reason for the lack of change in the Congress approval trend may be simply that approval is so low already. The current 13% reading, based on interviewing conducted March 7-10, is just a few percentage points above the all-time low of 10% reached twice last year. At this low level, negative views of what Congress does, or does not do, are probably already "built into" the ratings. These low ratings could improve if Congress does something the public respects, but leave little room for a further drop if Americans continue to perceive Congress' activities negatively.
Congress approval has averaged 14% for the first quarter of 2013, compared with 15% for all of 2012, 17% in 2011, and 19% in 2010. In short, the readings so far this year continue a very negative period for the public's views of the job done by the men and women they elect and send to represent them in Washington.
Republicans, Independents, and Democrats Converge on Shared Low Ratings
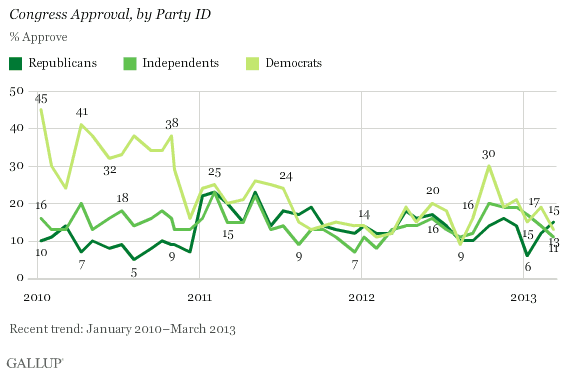
Republicans, independents, and Democrats have converged at nearly equal ratings of Congress, with approval ratings of 15%, 11%, and 13%, respectively. The three partisan groups' ratings generally have been similar for two years, except for one spike in approval among Democrats last October. When the Democrats controlled both houses of Congress before the November 2010 elections, rank-and-file Democrats were routinely much more positive than either of the other two partisan groups about Congress.

Implications
There are no signs that Americans' negative views of Congress are changing in either direction after the implementation of the budget sequester on March 1. Congress' job approval has averaged 14% so far this year, including March's reading of 13%, which is on par with Congress' 15% approval for all of 2012.
Survey Methods
Results for this Gallup poll are based on telephone interviews conducted March 7-10, 2013, with a random sample of 1,022 adults, aged 18 and older, living in all 50 U.S. states and the District of Columbia.
For results based on the total sample of national adults, one can say with 95% confidence that the margin of sampling error is ±4 percentage points.
Interviews are conducted with respondents on landline telephones and cellular phones, with interviews conducted in Spanish for respondents who are primarily Spanish-speaking. Each sample of national adults includes a minimum quota of 50% cellphone respondents and 50% landline respondents, with additional minimum quotas by region. Landline telephone numbers are chosen at random among listed telephone numbers. Cellphones numbers are selected using random digit dial methods. Landline respondents are chosen at random within each household on the basis of which member had the most recent birthday.
Samples are weighted to correct for unequal selection probability, nonresponse, and double coverage of landline and cell users in the two sampling frames. They are also weighted to match the national demographics of gender, age, race, Hispanic ethnicity, education, region, population density, and phone status (cellphone only/landline only/both, cellphone mostly, and having an unlisted landline number). Demographic weighting targets are based on the March 2012 Current Population Survey figures for the aged 18 and older U.S. population. Phone status targets are based on the July-December 2011 National Health Interview Survey. Population density targets are based on the 2010 census. All reported margins of sampling error include the computed design effects for weighting.
In addition to sampling error, question wording and practical difficulties in conducting surveys can introduce error or bias into the findings of public opinion polls.
View methodology, full question results, and trend data.
For more details on Gallup's polling methodology, visit www.gallup.com.
