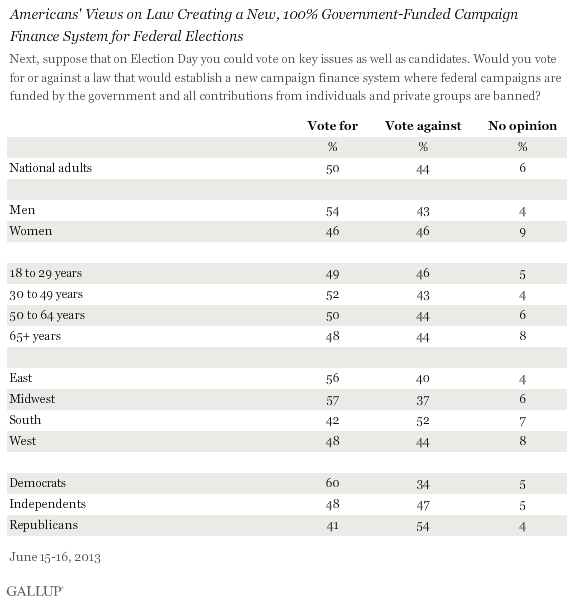
PRINCETON, NJ -- Half of Americans say they would personally vote for a law that establishes government funding of federal campaigns, while 44% would vote against it.

The poll was conducted June 15-16, just days before the New York State Senate narrowly defeated a comprehensive campaign reform bill for that state that would have included public financing of campaigns. Most key subgroups of Americans express fairly tepid support for this type of reform proposal. But Democrats, Easterners, and Midwesterners offer somewhat higher support; roughly six in 10 among these groups say they would vote for it. Among their counterparts, support drops below half. The only groups expressing majority opposition are those living in the South and Republicans.
Americans Would Limit Campaign Fundraising
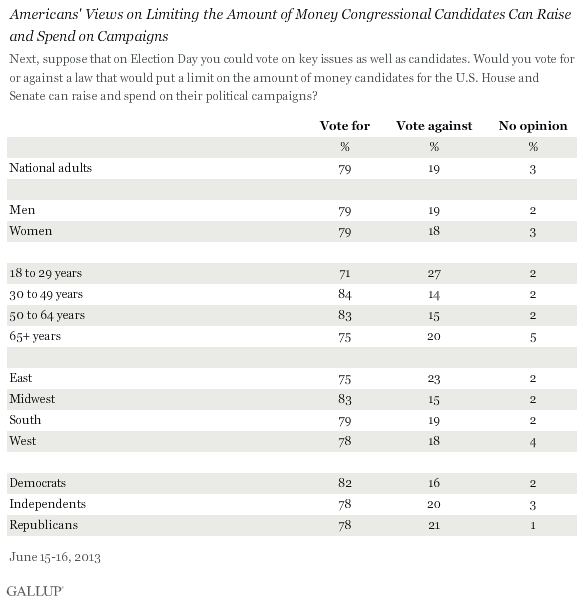
Americans are much more likely to support limiting the amount of money that U.S. House and Senate candidates can raise and spend for their campaigns. Nearly eight in 10 say they would vote for such a limit, whereas 19% would oppose it.

This proposal is also far less controversial, with close to 80% of nearly every major demographic and political group favoring it.
Bottom Line
Campaign finance reform is an area of public policy seemingly plagued by the law of unintended consequences. Case in point: While the 2002 McCain-Feingold law was supposed to put an end to the influence of big money in politics, eager donors turned to independent expenditures financed through Super PACs as a way to conduct unlimited political advertising. And given the legal protection these received as "free speech" in the Supreme Court's 2010 Citizens United decision, there is more money than ever flowing into politics.
Over the years, Gallup has consistently found Americans dissatisfied with the way campaigns are financed, but not especially eager for Congress to make addressing it a high priority. Similarly, while Americans have supported a whole host of campaign reform proposals involving enhanced disclosure and caps on what candidates can raise and spend, they have shown more reluctance toward footing the bill through federal financing. That was clearly the case in 2007, when 57% called public financing "unacceptable." There may be less objection today, with fewer than half, 44%, now saying they would vote "no" if given the chance to vote on implementing a public financing system, and public confidence in Congress historically low. Nevertheless, it remains to be seen how hard Americans will press Congress to enact such a major reform.
Survey Methods
Results are based on telephone interviews conducted as part of Gallup Daily tracking June 15-16, 2013, with a random sample of 1,015 adults, aged 18 and older, living in all 50 U.S. states and the District of Columbia.
For results based on the total sample of national adults, one can say with 95% confidence that the maximum margin of sampling error is ±3 percentage points.
Interviews are conducted with respondents on landline telephones and cellular phones, with interviews conducted in Spanish for respondents who are primarily Spanish-speaking. Each sample of national adults includes a minimum quota of 50% cellphone respondents and 50% landline respondents, with additional minimum quotas by region. Landline telephone numbers are chosen at random among listed telephone numbers. Cellphone numbers are selected using random digit dial methods. Landline respondents are chosen at random within each household on the basis of which member had the most recent birthday.
Samples are weighted to correct for unequal selection probability, nonresponse, and double coverage of landline and cell users in the two sampling frames. They are also weighted to match the national demographics of gender, age, race, Hispanic ethnicity, education, region, population density, and phone status (cellphone only/landline only/both, cellphone mostly, and having an unlisted landline number). Demographic weighting targets are based on the March 2012 Current Population Survey figures for the aged 18 and older U.S. population. Phone status targets are based on the July-December 2011 National Health Interview Survey. Population density targets are based on the 2010 census. All reported margins of sampling error include the computed design effects for weighting.
In addition to sampling error, question wording and practical difficulties in conducting surveys can introduce error or bias into the findings of public opinion polls.
View methodology, full question results, and trend data.
For more details on Gallup's polling methodology, visit www.gallup.com.
