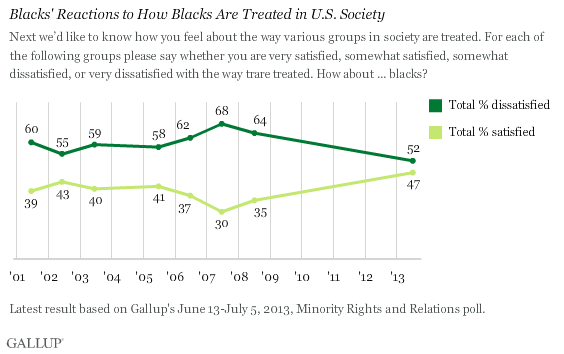
PRINCETON, NJ -- Just prior to the announcement of the verdict in the George Zimmerman trial, Gallup found about half of blacks, 52%, feeling dissatisfied with the way blacks are treated in the U.S. Slightly less, 47%, were satisfied. While tilting negative, these views are significantly better than what Gallup found from 2001 through 2008, before Barack Obama became the first black U.S. president.
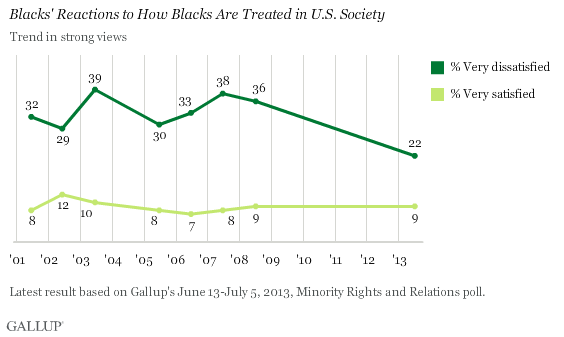
These broad views are based on those either very or somewhat satisfied, or very or somewhat dissatisfied. In terms of intensity, many more blacks are very dissatisfied, as opposed to very satisfied, with how members of their race are treated in society: 22% vs. 9%. But here, too, the sharply negative outlook is at a low point relative to the prior decade.
Blacks' views on this question contrast with those of whites and Hispanics. The last two groups are largely satisfied with how they believe blacks are treated: 67% of non-Hispanic whites and 61% of Hispanics express this sentiment. Like blacks, Hispanics are more positive about the treatment of blacks today than they were from 2001-2008, while whites' views haven't changed much.
Also, while relatively few whites and Hispanics are very satisfied with the treatment of blacks, more are very satisfied than very dissatisfied.
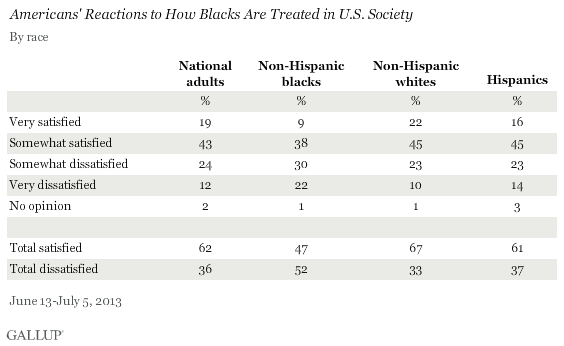
Blacks' perceptions of how they are treated in the U.S. are generally similar to Hispanics' views of how Hispanics are treated. Fifty-one percent of Hispanics are satisfied and 49% dissatisfied with the treatment of U.S. Hispanics.
Black Women Express Greater Dissatisfaction Than Black Men
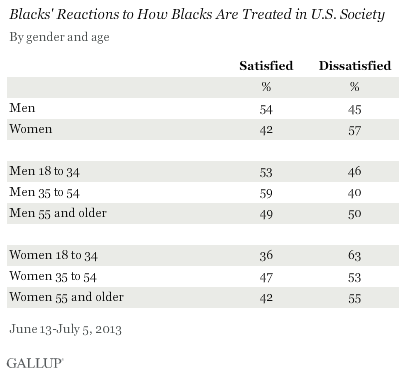
Among blacks, certain groups are more satisfied than others with how blacks are treated in society, although the differences aren't huge.
Despite the focus that the Trayvon Martin tragedy has put on the challenges young black men face from negative stereotypes and racial profiling, black men are more likely than black women to report feeling satisfied with the treatment of blacks in society. This holds at every age level.
Additionally, young and middle-aged black men are more likely than those 55 and older to be satisfied with the treatment of blacks. Conversely, young black women are the least satisfied.
Victims of Perceived Racial Discrimination Less Satisfied With Blacks' Treatment
A key question is whether blacks' attitudes about how society treats blacks are related more to general perceptions of how blacks are treated, or to their own personal experiences.
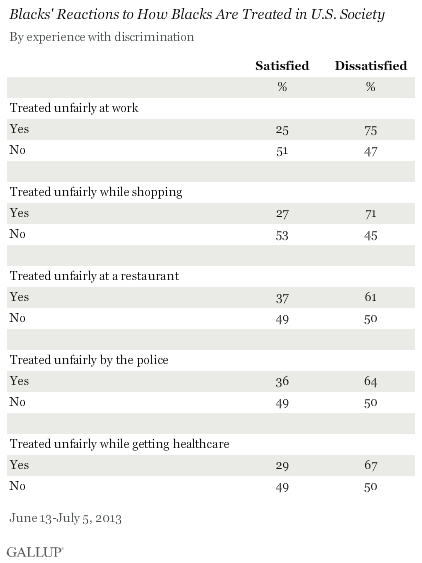
The poll indicates that blacks' satisfaction with society's treatment of their race is strongly related to whether they have personally felt victimized by racial bias. For instance, 25% of blacks who report having been treated unfairly at work on account of their race are satisfied with the treatment of blacks in the U.S., compared with 51% who have not experienced unfair treatment at work.
Similarly, satisfaction is lower among blacks who have felt racially discriminated against while shopping, seeking healthcare, and at work. While present, the relationship is less pronounced with respect to discrimination when dining out or in dealings with the police.
Bottom Line
Gallup's survey, conducted before Zimmerman was acquitted of the murder and manslaughter of Martin, documents where black Americans' attitudes about societal treatment stood on the brink of the decision -- at a possible high point less than a year after the nation re-elected its first black president. While far from ideal, blacks' views about societal treatment were more upbeat than they had been since Gallup first asked about the topic in 2001. And these views are strongly tied to whether blacks have personally experienced race-based mistreatment in certain settings.
Future Gallup polling on this question will reveal whether that pattern remains in the aftermath of a trial that has thrust racial profiling back into the news, and even sparked demonstrations among those who believe the case highlights culture-wide racial biases that erode black Americans' safety and freedom. As such, it could prove to be a watershed event in how not just blacks, but all Americans, perceive society's treatment of blacks today.
Survey Methods
Results are based on telephone interviews conducted June 13-July 5, 2013 with 4,373 adults, aged 18 and older, living in all 50 U.S. states and the District of Columbia, including oversamples of black and Hispanic adults. All respondents had previously been interviewed in the Gallup Daily tracking survey. The total sample is weighted to represent racial and ethnic groups proportionately to their share of the U.S. population. For results based on this sample of national adults, one can say with 95% confidence that the margin of error is ±2 percentage points.
For results based on sample of 1,010 non-Hispanic blacks, the maximum margin of sampling error is ±5 percentage points.
For results based on sample of 1,000 Hispanics, the maximum margin of sampling error is ±6 percentage points. (332 out of the 1,000 interviews with Hispanics were conducted in Spanish.)
Interviews are conducted with respondents on landline telephones and cellular phones, with interviews conducted in Spanish for respondents who are primarily Spanish-speaking.
Samples are weighted to correct for unequal selection probability, non-response, and double coverage of landline and cell users in the two sampling frames. They are also weighted to match the national demographics of gender, age, race, Hispanic ethnicity, education, region, population density, and phone status (cell phone-only/landline only/both and cell phone mostly). Demographic weighting targets are based on the March 2012 Current Population Survey figures for the aged 18 and older U.S. population. Phone status targets are based on the July-December 2011 National Health Interview Survey. Population density targets are based on the 2010 census. All reported margins of sampling error include the computed design effects for weighting.
In addition to sampling error, question wording and practical difficulties in conducting surveys can introduce error or bias into the findings of public opinion polls.
For more details on Gallup's polling methodology, visit www.gallup.com.
