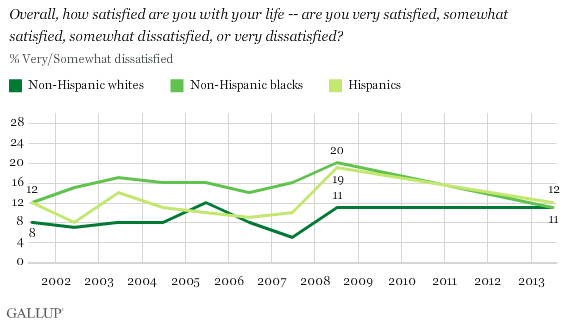
WASHINGTON, D.C. -- In the U.S., blacks and Hispanics since 2008 have grown more likely to say they are satisfied with their lives, while whites' satisfaction has remained unchanged. As a result, the three groups are now about equally likely to be satisfied with their lives.
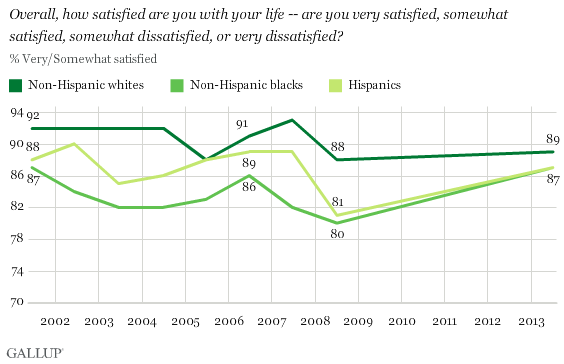
These data are from Gallup's Minority Rights and Relations poll, conducted June 13-July 5. The poll surveyed 4,373 Americans, including 1,010 non-Hispanic blacks and 1,000 Hispanics.
Breaking out the trends in the percentage "very satisfied" versus "somewhat satisfied" reveals that blacks have become slightly more likely to be very satisfied with their lives since 2008. Forty-two percent say so now, compared with 38% then.
Hispanics' higher overall satisfaction has come from an uptick in the percentage who are somewhat satisfied, rising to 44% today, from 39% in 2008. Although whites' overall satisfaction has not changed since 2008, the percentage very satisfied has decreased, while the "somewhat satisfied" has increased.
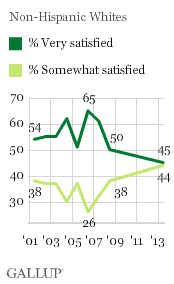
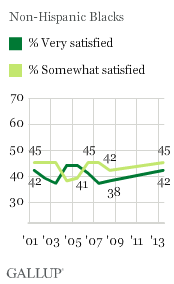
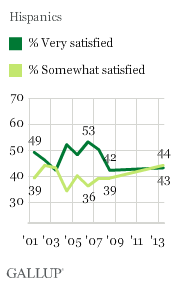
As their satisfaction has increased, blacks' and Hispanics' dissatisfaction has decreased. Whites' satisfaction remains unchanged from 2008. As a result, whites, blacks, and Hispanics are now equally likely to be dissatisfied with their lives.
Bottom Line
Blacks' uptick in satisfaction with their lives coincides with the Obama presidency. Gallup has seen a similar pattern in blacks' views of their standard of living and ratings of their lives on a ladder scale. Blacks' Standard of Living Index score shot up in January 2009, when Barack Obama first took office, while whites' standard-of-living perceptions saw only a slight increase. In February of that year, blacks' perceptions surpassed whites', and these differences by race persist today.
Thus, it is likely that the increase in positivity among blacks on these measures is partly tied to either the election of a black president or to the fact that he is a Democrat. The vast majority of blacks are Democrats and voted for President Obama and continue to approve of the job he is doing. So, while it is unclear whether blacks' lives have actually improved more than whites' since 2008, it is clear that they believe their lives have changed for the better. However, Gallup did not track these satisfaction questions prior to the Bush administration and thus does not have comparable data for when Democrat Bill Clinton was president.
Importantly, life satisfaction is one area where blacks, whites, and Hispanics today respond similarly, in contrast to their views on a variety of topics included in the same poll, such as perceptions of racial discrimination in the U.S. and the treatment of blacks in society.
Survey Methods
Results are based on telephone interviews conducted June 13-July 5, 2013 with 4,373 adults, aged 18 and older, living in all 50 U.S. states and the District of Columbia, including oversamples of black and Hispanic adults. All respondents had previously been interviewed in the Gallup Daily tracking survey. The total sample is weighted to represent racial and ethnic groups proportionately to their share of the U.S. population.
For results based on this sample of national adults, one can say with 95% confidence that the margin of error is ±2 percentage points.
For results based on sample of 2,149 non-Hispanic whites, the margin of sampling error is ±3 percentage points.
For results based on sample of 1,010 non-Hispanic blacks, the margin of sampling error is ±5 percentage points.
For results based on sample of 1,000 Hispanics, the maximum margin of sampling error is ±6 percentage points.
Interviews are conducted with respondents on landline telephones and cellular phones, with interviews conducted in Spanish for respondents who are primarily Spanish-speaking.
Samples are weighted to correct for unequal selection probability, non-response, and double coverage of landline and cell users in the two sampling frames. They are also weighted to match the national demographics of gender, age, race, Hispanic ethnicity, education, region, population density, and phone status (cell phone-only/landline only/both and cell phone mostly). Demographic weighting targets are based on the March 2012 Current Population Survey figures for the aged 18 and older U.S. population. Phone status targets are based on the July-December 2011 National Health Interview Survey. Population density targets are based on the 2010 census. All reported margins of sampling error include the computed design effects for weighting.
In addition to sampling error, question wording and practical difficulties in conducting surveys can introduce error or bias into the findings of public opinion polls.
View methodology, full question results, and trend data.
For more details on Gallup's polling methodology, visit www.gallup.com.
