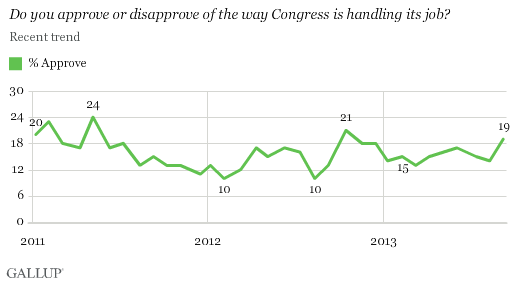
PRINCETON, NJ -- Americans remain highly critical of the job Congress is doing, but the 19% who approve is up significantly from 14% last month, and the highest in any month since October 2012. Congress' approval rating has exceeded the current 19% on only a few occasions over the last three years, a span that includes the all-time low ratings of 10% in February 2012 and August 2012.
The latest evaluation of Congress comes as the institution is considering President Barack Obama's request that it authorize U.S. military action against Syria in response to reports that the country's leaders used chemical weapons on its citizens. The Sept. 5-8 poll was conducted before Obama's nationwide address about the situation in Syria on Sept. 10, and before he asked Congress to delay a vote to give new Russian diplomatic proposals a chance to work.
In contrast to Congress' ratings, President Obama's overall job approval ratings and ratings on specific issues have not improved in recent weeks. However, his job approval rating, currently at 45% in Gallup Daily tracking, remains much higher than that of Congress. His approval rating for handling the situation in Syria, specifically -- again from the pre-speech Sept. 5-8 poll -- is 31%.
Congress Approval Ratings Better Among All Party Groups
Ratings of Congress are improved among all party groups compared with August. Republicans' approval has increased five percentage points to 18%, independents' ratings have gone up six points to 19%, while Democrats' approval has increased three points to 20%.
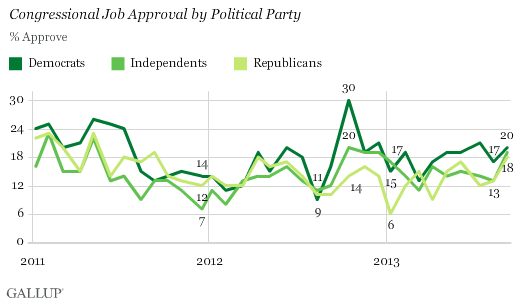
Since the middle of last year, Republicans have generally given Congress lower approval ratings than have Democrats or independents. But now Republicans' ratings of Congress are about the same as those of the other party groups.
Implications
Congress' approval rating remains low, and well below the historical average of 33% since Gallup began asking the question in 1974. However, given that Congress' ratings have been almost exclusively below 20% the last three years, its current 19% approval rating seems positive by comparison.
The timing of the recent poll -- closely following the president's request for authorization to use force in Syria -- combined with Americans' opposition to such action suggests that Congress' apparent lack of enthusiasm about this military intervention may be the reason for the increase in its approval rating. Before Obama asked for a delay in the congressional vote, it was unclear whether Congress would authorize military action against Syria, with many more members publicly opposing it than publicly favoring it, and a large number undecided.
Survey Methods
Results for this Gallup poll are based on telephone interviews conducted Sept. 5-8, 2013, with a random sample of 1,510 adults, aged 18 and older, living in all 50 U.S. states and the District of Columbia.
For results based on the total sample of national adults, one can say with 95% confidence that the margin of sampling error is ±3 percentage points.
Interviews are conducted with respondents on landline telephones and cellular phones, with interviews conducted in Spanish for respondents who are primarily Spanish-speaking. Each sample of national adults includes a minimum quota of 50% cellphone respondents and 50% landline respondents, with additional minimum quotas by region. Landline and cell telephone numbers are selected using random-digit-dial methods. Landline respondents are chosen at random within each household on the basis of which member had the most recent birthday.
Samples are weighted to correct for unequal selection probability, nonresponse, and double coverage of landline and cell users in the two sampling frames. They are also weighted to match the national demographics of gender, age, race, Hispanic ethnicity, education, region, population density, and phone status (cellphone only/landline only/both, and cellphone mostly). Demographic weighting targets are based on the March 2012 Current Population Survey figures for the aged 18 and older U.S. population. Phone status targets are based on the July-December 2011 National Health Interview Survey. Population density targets are based on the 2010 census. All reported margins of sampling error include the computed design effects for weighting.
In addition to sampling error, question wording and practical difficulties in conducting surveys can introduce error or bias into the findings of public opinion polls.
View methodology, full question results, and trend data.
For more details on Gallup's polling methodology, visit www.gallup.com.