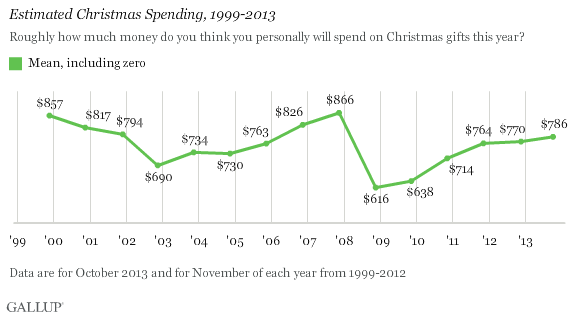
PRINCETON, NJ -- Americans, on average, expect to spend $786 on Christmas gifts this year, which is similar to their holiday spending estimates in each of the past two years. While not great news for the nation's retailers, it portends respectable seasonal sales growth -- particularly important in light of the recent government shutdown.

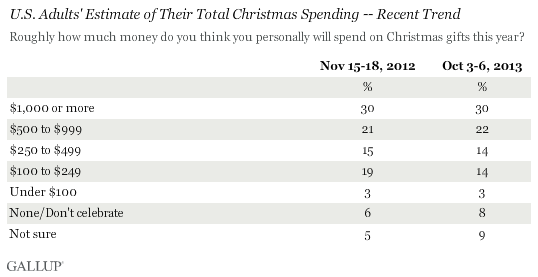
Nearly nine in 10 U.S. adults say they will spend some amount of money this year on Christmas gifts. Underscoring the importance Americans place on holiday gift giving, 30% -- identical to last year -- plan to spend at least $1,000, and half plan to spend at least $500. Only 3% intend to spend less than $100.

The current figures are based on an Oct. 3-6 Gallup poll, conducted in the first few days of the partial federal government shutdown. That closure, and the partisan stalemate preceding it, caused consumers' attitudes to sour on a number of dimensions, including their confidence in the economy, perceptions of their own standard of living, and their self-reported daily spending. With Americans' early October forecast for holiday spending the highest since 2007, at least numerically if not statistically, this could be a welcome indication of consumer resilience.
Now that the shutdown is over, consumers' Christmas spending intentions could change, and perhaps swell further, resulting in an even more robust holiday retail season than the October data indicate. Gallup's November measure will provide an important post-shutdown update on these spending projections.
Prediction: Growth Between 3.7% and 4.0% Over Last Year
The relationship between Gallup's Christmas spending estimate and actual holiday retail sales (as calculated by the National Retail Federation) is not precise. Still, Gallup has been measuring Americans' intended Christmas spending since 1999, and over that time, the November forecast has been particularly useful in predicting changes in holiday sales. In years when consumers' projected holiday spending is either flat or up slightly, such as Gallup finds today, actual retail sales growth tends to be average or better.
Even if Americans' spending intentions hold at the current level into November, Gallup's model suggests that 2013 holiday spending is likely to grow by between 3.7% and 4.0% over last year's level. That is not as strong as the growth in holiday spending in 2010 and 2011, but roughly comparable to 2012 and slightly above the average 3.3% increase of the last 10 years, as calculated by the National Retail Federation.
Fewer Americans Say They Will Spend "Less"
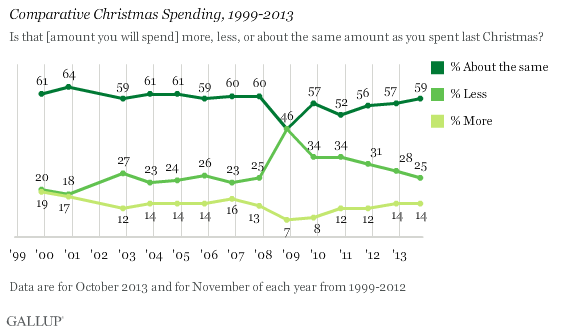
Most Americans predict they will spend the same or less this Christmas compared with last year, while relatively few -- 14% -- say they will spend more. This pattern is typical of the way Americans have answered this question over the years.
However, the percentage saying they will spend less has declined or stayed level each year since the 2008 financial crisis, while the percentage saying they will spend more has inched up. Today's figures are in line with those of the pre-crisis period from 2002 through 2007 -- yet another indication that retailers will see average, if not robust, sales growth this year.

Bottom Line
Gallup's initial measure of Americans' 2013 holiday spending intentions provides retailers with a basis for cautious optimism. Even with the political chaos surrounding the government shutdown in early October and the resulting decline in economic confidence, Americans' predictions for how much they will spend on gifts suggest a nearly 4% increase in year-over-year sales. This falls well short of the 6% to 8% increases seen in better economic times, and lags behind roughly 5% increases seen in 2010 and 2011, but is markedly better than the 2008 and 2009 holiday seasons, when spending barely grew, or even contracted.
While there is reason to believe consumers may feel even more generous in November than they did when the October survey was conducted, that is far from certain. At this point, retailers would be wise to plan for modest sales growth.
Survey Methods
Results for this Gallup poll are based on telephone interviews conducted Oct. 3-6, 2013, with a random sample of 1,028 adults, aged 18 and older, living in all 50 U.S. states and the District of Columbia.
For results based on the total sample of national adults, one can say with 95% confidence that the margin of sampling error is ±4 percentage points.
Interviews are conducted with respondents on landline telephones and cellular phones, with interviews conducted in Spanish for respondents who are primarily Spanish-speaking. Each sample of national adults includes a minimum quota of 50% cellphone respondents and 50% landline respondents, with additional minimum quotas by region. Landline and cell telephone numbers are selected using random-digit-dial methods. Landline respondents are chosen at random within each household on the basis of which member had the most recent birthday.
Samples are weighted to correct for unequal selection probability, nonresponse, and double coverage of landline and cell users in the two sampling frames. They are also weighted to match the national demographics of gender, age, race, Hispanic ethnicity, education, region, population density, and phone status (cellphone only/landline only/both, and cellphone mostly). Demographic weighting targets are based on the March 2012 Current Population Survey figures for the aged 18 and older U.S. population. Phone status targets are based on the July-December 2011 National Health Interview Survey. Population density targets are based on the 2010 census. All reported margins of sampling error include the computed design effects for weighting.
In addition to sampling error, question wording and practical difficulties in conducting surveys can introduce error or bias into the findings of public opinion polls.
View methodology, full question results, and trend data.
For more details on Gallup's polling methodology, visit www.gallup.com.
