PRINCETON, NJ -- Americans' views of the 2010 healthcare law have worsened in recent weeks, with 40% approving and 55% disapproving of it. For most of the past year, Americans have been divided on the law, usually tilting slightly toward disapproval. The now 15-percentage-point gap between disapproval and approval is the largest Gallup has measured in the past year.

The results are based on Gallup's annual Health and Healthcare poll, conducted Nov. 7-10.
Currently, 73% of Democrats, 39% of independents, and 8% of Republicans approve of the healthcare law. Approval is down at least marginally among all three groups since Gallup's last update in late October.
Since the government health insurance exchanges opened on Oct. 1, Americans' views of the healthcare law remained fairly steady even amid reports of widespread technical glitches with the websites.
More recently, President Barack Obama has had to respond to charges that he misled Americans when he repeatedly said those who liked their current insurance plans could keep them. Many insured Americans are now being dropped from their health plans, perhaps because the plans do not meet the minimum requirements for coverage mandated by the healthcare law. Obama has apologized for making those assurances and said he would explore options to help those affected.
The timing of this drop in approval of the law suggests it may be linked to the controversy over the millions of Americans losing their current health insurance coverage.
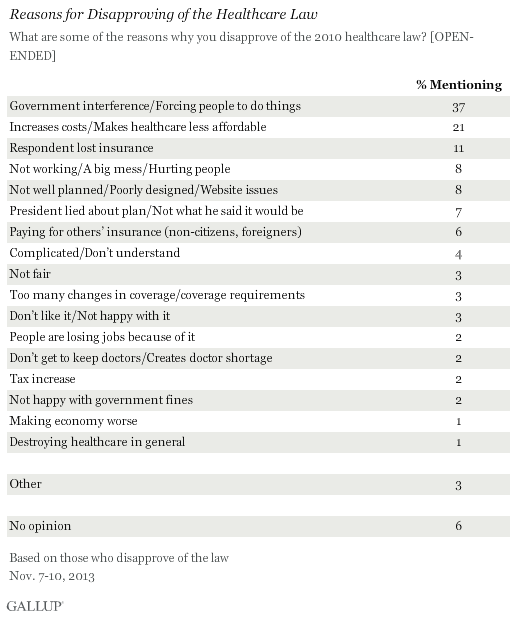
In fact, in an open-ended question probing Americans' reasons for approving or disapproving of the law, 11% of those who disapprove specifically mention losing their insurance. Another 7% say the president lied about details of the law.
These are not the most common reasons for disapproval, however. The leading complaint is a philosophical objection -- government interference or forcing people to get healthcare -- mentioned by 37% of those who disapprove. Twenty-one percent believe the law will increase costs and make healthcare less affordable. Eight percent specifically mention planning, design, or website problems; another 8% say the law is "not working."

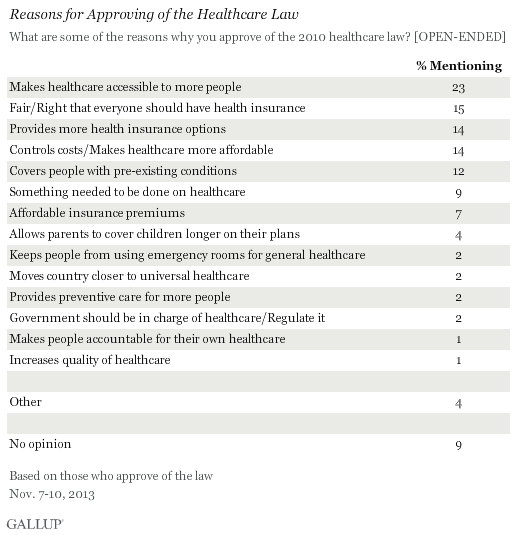
The most common reason for approving of the law, mentioned by 23%, is the belief that it makes healthcare accessible to more people. Other common reasons for approval are the belief that everyone has a right to health insurance, that the law expands the number of insurance options available to Americans, will control costs, and covers people with pre-existing conditions.

Implications
Gallup has long found that Americans have been generally divided in their views of the healthcare law, both before and after its passage. Now, they are tilting more significantly toward disapproval.
That more negative evaluation may not have as much to do with the content of the law as the implementation of it, in particular how that squares with the president's earlier characterization of how the law would work.
Some Democratic members of Congress, as well as former President Bill Clinton, are urging the president to support legislation that would rewrite portions of the law to allow Americans to keep their insurance plan if they are being dropped from it, as a way to honor his pledge. At this point, it is not clear whether the president will seriously consider that, or attempt to adjust how the law is administered without rewriting pieces of it.
Additionally, many members of Congress from both parties are asking the administration to extend the deadline by a year for Americans to get health insurance before facing a fine, given the ongoing technical issues with the exchange websites, which are still being fixed. The White House recently extended the deadline by six weeks.
How the administration handles these challenges to the implementation of the law, plus any new ones that emerge in the coming months, could be critical in determining the trajectory of the "disapprove" line in Gallup's trend chart for the healthcare law.
Survey Methods
Results for this Gallup poll are based on telephone interviews conducted Nov. 7-10, 2013, with a random sample of 1,039 adults, aged 18 and older, living in all 50 U.S. states and the District of Columbia.
For results based on the total sample of national adults, one can say with 95% confidence that the margin of sampling error is ±4 percentage points.
Interviews are conducted with respondents on landline telephones and cellular phones, with interviews conducted in Spanish for respondents who are primarily Spanish-speaking. Each sample of national adults includes a minimum quota of 50% cellphone respondents and 50% landline respondents, with additional minimum quotas by time zone within region. Landline and cellular telephone numbers are selected using random-digit-dial methods. Landline respondents are chosen at random within each household on the basis of which member had the most recent birthday.
Samples are weighted to correct for unequal selection probability, nonresponse, and double coverage of landline and cell users in the two sampling frames. They are also weighted to match the national demographics of gender, age, race, Hispanic ethnicity, education, region, population density, and phone status (cellphone only/landline only/both, cellphone mostly, and having an unlisted landline number). Demographic weighting targets are based on the March 2012 Current Population Survey figures for the aged 18 and older U.S. population. Phone status targets are based on the July-December 2011 National Health Interview Survey. Population density targets are based on the 2010 census. All reported margins of sampling error include the computed design effects for weighting.
In addition to sampling error, question wording and practical difficulties in conducting surveys can introduce error or bias into the findings of public opinion polls.
For more details on Gallup's polling methodology, visit www.gallup.com.
