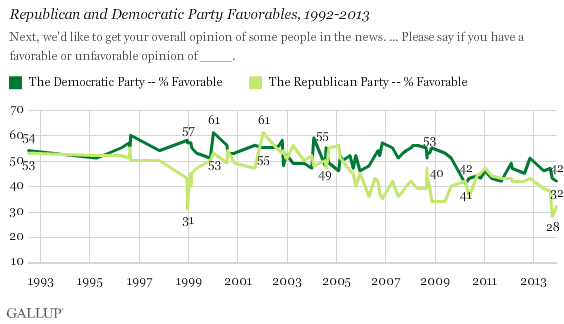
WASHINGTON, D.C. -- Americans continue to see the Democratic and Republican parties unfavorably, as a year marred by high-profile policy failures for both parties comes to a close. The Republican Party's favorability has improved slightly to 32% from an all-time low of 28% in October during the government shutdown, while 61% now view the GOP unfavorably. The Democratic Party -- on the defensive recently for the flawed rollout of the healthcare website -- maintains a favorable rating of 42%. But a majority of Americans, 53%, now see the party unfavorably, up from 49% in October.

These results come from a Gallup poll conducted Dec. 5-8. Other polls have found Democrats losing a once-substantial advantage in the generic congressional ballot for the 2014 midterm elections; nevertheless, Gallup finds that, overall, Americans still view the Democratic Party more favorably than the Republican Party.
Still, both parties have lost ground with the public compared with earlier this year; in June, 39% of Americans had a favorable image of the Republican Party, while nearly half (46%) had a favorable image of the Democratic Party.
The two parties' favorability ratings are at the lower end of the range Gallup has measured for each, although the GOP has the lower absolute rating. The Democratic Party's current favorability rating of 42% is similar to what it was during most of 2010 -- a year in which the Democrats lost 63 House seats and majority control in that chamber.
Moderates More Likely to Prefer Democratic Party Over Republican Party
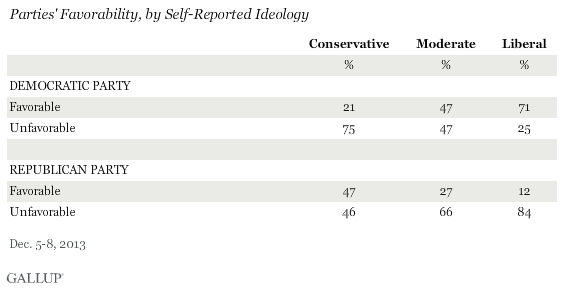
While the two parties rely on their ideological soul mates for support -- Republicans depend on conservatives, while Democrats lean on liberals -- both parties also need at least some support from the political center to win elections. Self-described moderates are more likely to have a favorable image of the Democratic Party (47%) than of the Republican Party (27%), which may prove problematic for the GOP next year in the congressional elections. It is worth noting, however, that moderates typically lean more Democratic than Republican.

The Republican Party can hardly claim to have locked up its support among conservatives, who are as likely to have a favorable (47%) as an unfavorable (46%) image of the GOP. Liberals, by contrast, are more unified in their support for the Democratic Party, with 71% viewing the party favorably.
Implications
Neither party closes out the year with a positive public image, but Republicans have had a worse year in terms of overall favorability. The damage wrought by the federal government shutdown has not dissipated much for the GOP. In addition, the party, at least in terms of its favorability, has failed to benefit much from the healthcare law's woes, or the decline in the president's job approval rating.
Survey Methods
Results for this Gallup poll are based on telephone interviews conducted Dec. 5-8, 2013, on the Gallup Daily tracking survey, with a random sample of 1,031 adults, aged 18 and older, living in all 50 U.S. states and the District of Columbia.
For results based on the total sample of national adults, the margin of sampling error is ±4 percentage points at the 95% confidence level.
Interviews are conducted with respondents on landline telephones and cellular phones, with interviews conducted in Spanish for respondents who are primarily Spanish-speaking. Each sample of national adults includes a minimum quota of 50% cellphone respondents and 50% landline respondents, with additional minimum quotas by region. Landline and cell telephone numbers are selected using random-digit-dial methods. Landline respondents are chosen at random within each household on the basis of which member had the most recent birthday.
Samples are weighted to correct for unequal selection probability, nonresponse, and double coverage of landline and cell users in the two sampling frames. They are also weighted to match the national demographics of gender, age, race, Hispanic ethnicity, education, region, population density, and phone status (cellphone only/landline only/both, and cellphone mostly). Demographic weighting targets are based on the March 2012 Current Population Survey figures for the aged 18 and older U.S. population. Phone status targets are based on the July-December 2011 National Health Interview Survey. Population density targets are based on the 2010 census. All reported margins of sampling error include the computed design effects for weighting.
In addition to sampling error, question wording and practical difficulties in conducting surveys can introduce error or bias into the findings of public opinion polls.
View methodology, full question results, and trend data.
For more details on Gallup's polling methodology, visit www.gallup.com.
