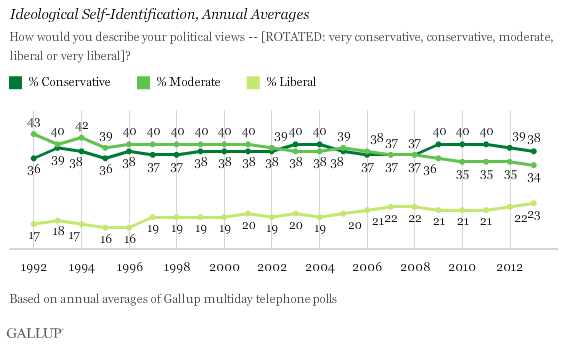
PRINCETON, NJ -- Americans continue to be more likely to identify as conservatives (38%) than as liberals (23%). But the conservative advantage is down to 15 percentage points as liberal identification edged up to its highest level since Gallup began regularly measuring ideology in the current format in 1992.

The figures are based on combined data from 13 separate Gallup polls, including interviews with more than 18,000 Americans, conducted in 2013.
When Gallup began asking about ideological identification in all its polls in 1992, an average 17% of Americans said they were liberal. That dipped to 16% in 1995 and 1996, but has gradually increased, exceeding 20% each year since 2005.
The rise in liberal identification has been accompanied by a decline in moderate identification. At 34% in 2013, it is the lowest Gallup has measured, and down nine points since 1992. Moderates had been the largest ideological group throughout the 1990s, and competed with conservatives for the top spot during the 2000s. Since 2009, conservatives have consistently been the largest U.S. ideological group.
The percentage of conservatives has always far exceeded the percentage of liberals, by as much as 22 points in 1996. With more Americans identifying as liberals in recent years, and conservative identification holding steady, the conservative advantage of 15 points ties the 2007 and 2008 gaps as the smallest.
Democrats Increasingly Likely to Identify as Liberal
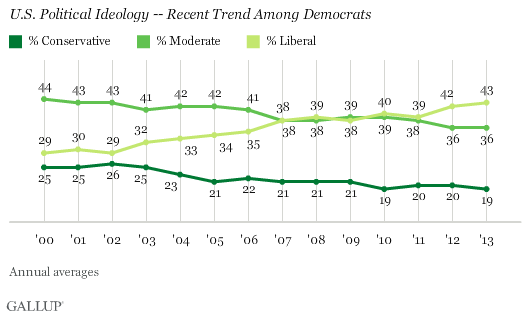
The shift toward greater liberal self-identification has been led by Democrats. Currently, 43% of Democrats say they are liberal, a nearly 50% increase from 29% in 2000. Over the same period, the percentage of Democrats identifying as moderate is down to 36% from 44%, and conservative identification is down to 19% from 25%.

From 2000 through 2006, Democrats were much more likely to describe their ideology as moderate than as liberal. In 2007, the year the Democratic Party regained control of both houses of Congress for the first time since 1994, the two lines converged, with Democrats equally likely to call themselves moderates or liberals. Now, in each of the last two years, Democrats have been more likely to describe their views as liberal than as moderate.
These changes are a telling indicator of the shift in the Democratic Party from a party that was more ideologically diverse to one that is increasingly dominated by those from the left end of the ideological spectrum.
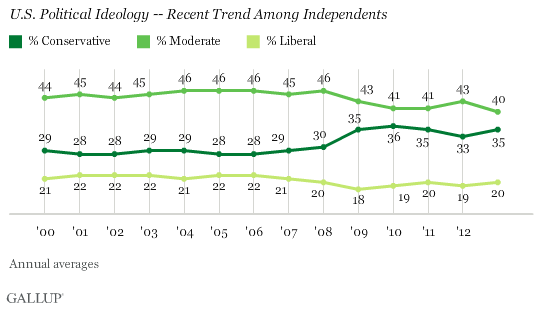
In fact, the rise in liberal identification among all Americans is due exclusively to the changes among Democrats. Independents are no more likely now than in the past to describe their political views as liberal. The main change in independents' views is that they increasingly call themselves conservative. That could be related to recent developments in party identification, with fewer Americans now identifying as Republicans and more as independents. Thus, the change in independents' ideological preferences may be attributable to former Republicans, who are more likely to be politically conservative, now residing in the independent category.

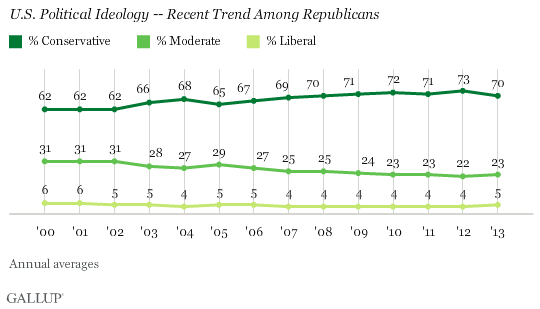
Republicans have become more likely to describe their political views as conservative over the past 13 years, from 62% in 2000 to 70% in 2013. The percentage of Republicans saying their political views are moderate has dropped by an equivalent amount, from 31% to 23%. To some degree that may be a function of declining Republican Party identification in the U.S., now at a 25-year low of 25%. The smaller group of present Republican identifiers is likely more ideologically homogeneous than the larger group of Republican identifiers from a decade ago.

The increasing percentages of Republicans and independents who identify as political conservatives has helped keep the overall percentage of conservatives stable in recent years, offsetting the decline in conservative identification among Democrats. The drop in U.S. moderates is because of declines among all three major political party groups.
Implications
Americans' perceptions of their political views -- if not the views themselves -- are undergoing unmistakable change, contributing to greater political polarization in the country. Now, the plurality of Democrats consider themselves to be politically liberal, whereas a decade ago, Democrats were most likely to say they were moderate. That could be because Democrats are now more comfortable calling themselves "liberal" -- a term that was less popular in the recent past -- even if their current and past views on issues are similar. But it could also reflect an evolution in their views to favor more traditionally liberal issue positions.
Meanwhile, Republicans, who have always been overwhelmingly conservative, have become increasingly so. One manifestation of that may have been a series of primary election challenges for long-serving GOP members of Congress by candidates aligned with the Tea Party movement.
These data confirm the tendency for Americans who identify with the two major parties to be more ideologically homogeneous than was the case in the past, a tendency that appears to be matched by the increasing polarization between Democratic and Republican members of Congress.
The changes in ideological identification among party groups has resulted in a rise in the percentage of Americans overall who call themselves liberal and a decrease in the percentage of moderates. Even though the percentage of conservatives has generally held steady, the rise in liberal identification leaves conservatives with their smallest advantage over liberals in the last two decades. If the trends in Democratic self-identification continue, that gap will likely continue to shrink over time, and could lead to further polarization in U.S. politics.
Survey Methods
Results are based on aggregated telephone interviews from 13 separate Gallup polls conducted in 2013, with a random sample of 18,871 adults, aged 18 and older, living in all 50 U.S. states and the District of Columbia.
For results based on the total sample of national adults, the margin of sampling error is ±1 percentage point at the 95% confidence level.
Interviews are conducted with respondents on landline telephones and cellular phones, with interviews conducted in Spanish for respondents who are primarily Spanish-speaking. Each sample of national adults includes a minimum quota of 50% cellphone respondents and 50% landline respondents, with additional minimum quotas by time zone within region. Landline and cellular telephone numbers are selected using random-digit-dial methods. Landline respondents are chosen at random within each household on the basis of which member had the most recent birthday.
Samples are weighted to correct for unequal selection probability, nonresponse, and double coverage of landline and cell users in the two sampling frames. They are also weighted to match the national demographics of gender, age, race, Hispanic ethnicity, education, region, population density, and phone status (cellphone only/landline only/both, cellphone mostly, and having an unlisted landline number). Demographic weighting targets are based on the March 2012 Current Population Survey figures for the aged 18 and older U.S. population. Phone status targets are based on the July-December 2012 National Health Interview Survey. Population density targets are based on the 2010 census. All reported margins of sampling error include the computed design effects for weighting.
In addition to sampling error, question wording and practical difficulties in conducting surveys can introduce error or bias into the findings of public opinion polls.
For more details on Gallup's polling methodology, visit www.gallup.com.
