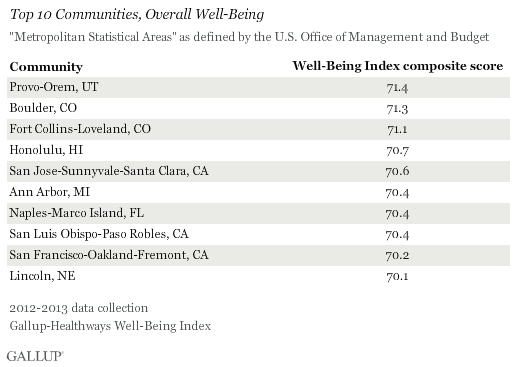
WASHINGTON, D.C. -- Provo-Orem, Utah, has the highest Well-Being Index score (71.4) in the U.S. across 189 communities Gallup and Healthways surveyed in 2012-2013. Also in the top 10 are Boulder, Colo.; Fort Collins-Loveland, Colo.; Honolulu, Hawaii; and San Jose-Sunnyvale-Santa Clara, Calif.

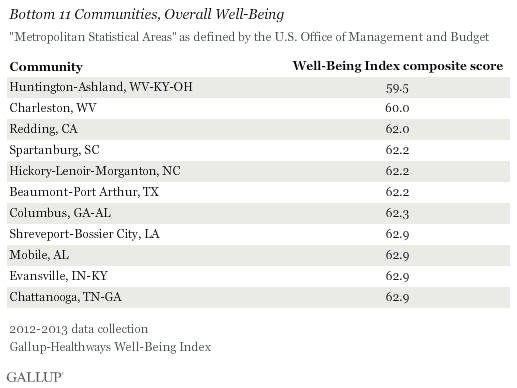
At 59.5, Huntington-Ashland, W.Va.-Ky.-Ohio, is the only community with a Well-Being Index score below 60. Huntington-Ashland also trailed all other metros in 2008, 2010, and 2011; its score of 58.1 in 2010 remains the lowest on record across five reporting periods spanning six years of data collection.
Charleston, W.Va., has the second-lowest score of 60.0. Redding, Calif.; Spartanburg, S.C.; Beaumont-Port Arthur, Texas; and Hickory-Lenoir-Morganton, N.C.; round out the bottom six -- with the last three communities tied with a score of 62.2. None of these metro areas are strangers to the bottom 10 list, with each community having appeared at least once on the list in a prior reporting period.

The regional breakdown in well-being scores is largely consistent with Gallup and Healthways state-level results, which find well-being generally higher in the Midwest and West, and lower in the South. West Virginia, which is home to at least a portion of the two lowest-rated metro areas (Huntington-Ashland and Charleston), ranked last in the nation for well-being among states for the fifth consecutive year in 2013. The state of California ranked 17th in overall well-being in 2013, but nevertheless boasts three metros in the top 10 for 2012-2013.
The Metropolitan Statistical Areas (MSAs) described in this article are defined by the U.S. Office of Management and Budget. In many cases, more than one city is included in the same MSA, and the same MSA can cross state borders (such as Huntington-Ashland). All reported MSAs encompass at least 300 completed surveys in 2012-2013, and Gallup has weighted each of these samples to ensure it is demographically representative of that MSA.
The Gallup-Healthways Well-Being Index score is an average of six sub-indexes, which individually examine life evaluation, emotional health, work environment, physical health, healthy behaviors, and access to basic necessities. The overall score and each of the six sub-index scores are calculated on a scale from 0 to 100, where a score of 100 represents the ideal. Gallup and Healthways have been tracking these measures daily since January 2008.
Ann Arbor Still No. 1 in Life Evaluation; Honolulu Best Off Emotionally
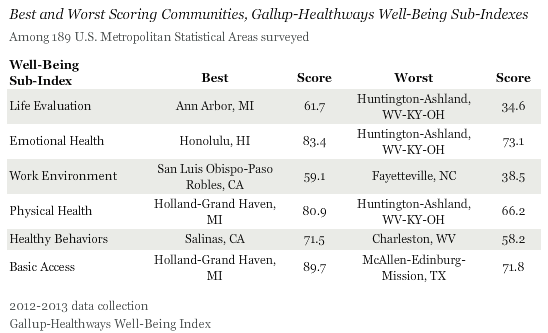
Although Provo-Orem has the highest overall well-being score, it does not lead in any of the six domains of well-being that we measured in 2012 and 2013. Residents of Ann Arbor, Mich., rated their current and future lives the best, for the second year in a row, and those of Huntington-Ashland rated theirs the worst.
Holland-Grand Haven, Mich., is the metro area with the highest Physical Health Index in the nation, displacing Fort Collins-Loveland, Colo., the community that held the spot in 2011. San Luis Obispo-Paso Robles, Calif., has the highest Work Environment Index score. Holland-Grand Haven, Mich., led the nation in access to basic necessities as it did in 2008-2010 (Gallup and Healthways did not conduct enough surveys in Holland-Grand Haven to report on it in 2011).

Residents of Huntington-Ashland rated their lives about half as well as those in Ann Arbor, and also described their physical health at levels far below what is found among residents of Holland-Grand Haven. Including its nation-leading score of 89.7 in the Basic Access Index, Holland-Grand Haven is the only community to boast a top ranking in more than one sub-index, although lower ratings in Life Evaluation and Work Environment kept it out of the top 10 overall.
Huntington-Ashland had the worst Emotional Health Index score, the third sub-index on which it ranks last nationally. Honolulu has been the top-rated U.S. metro area in the Emotional Health Index each measurement period since 2010 and has never ranked lower than second on this domain.
Healthy behaviors were least prevalent in Charleston and most prevalent in Salinas, Calif. Salinas reclaimed the top spot it occupied in 2010 after dropping to second place in 2011.
McAllen-Edinburg-Mission, Texas, residents reported the worst access to basic necessities for the fourth measurement period in a row, due in part to just 47% of residents who reported having health insurance, by far the lowest percentage in the nation. The metro area in the U.S. with the lowest score on the Basic Access Index has come from the state of Texas across all five reporting periods.
San Jose and San Francisco Top All Large Communities in Well-Being
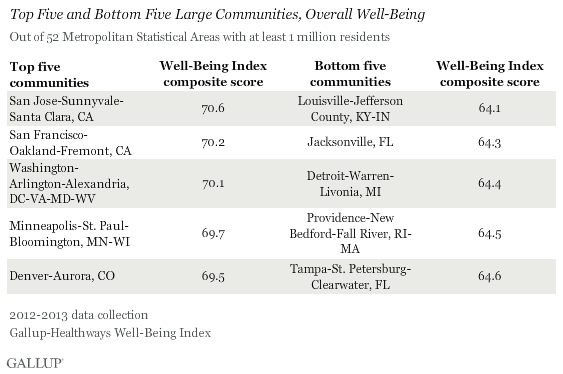
San Jose-Sunnyvale-Santa Clara residents reported the highest well-being among the nation's 52 largest (1 million or more residents) communities, followed by San Francisco-Oakland-Fremont, Calif., and Washington, D.C.-Arlington-Alexandria, Va.-Md.-W.Va. These three metros are commonly among the top of the list of large cities each year. San Jose-Sunnyvale-Santa Clara's overall rank of fifth across well-being areas of all sizes is the highest ever for a large metro area. Minneapolis-St. Paul-Bloomington, Minn.-Wis., also typically ranks in the top five, while Denver-Aurora, Colo., makes its first appearance on the list this year.
Louisville-Jefferson County, Ky.-Ind., which was ranked 50th among large metros in 2011, took over the bottom spot, displacing Las Vegas-Paradise, Nev., for the large metro area with the lowest well-being, due mostly to its residents' low physical, emotional, and healthy behaviors scores. Jacksonville, Fla., repeated its ranking of 51st from 2011.
Las Vegas-Paradise residents again reported the worst access to clean and safe water in the U.S. among large communities -- a recurring pattern for this metro area and a principle reason why it is ranked last nationally in basic access for the fifth-straight reporting period among large communities. In general, the six-point gap in well-being between the highest and lowest-rated large communities is half as large as the 11-point gap found between the highest and lowest scores amid all 189 reportable communities that Gallup and Healthways surveyed.

Implications
With about 80% of Americans living in urban or suburban areas, the role of cities in spearheading the well-being of the U.S. is significant. City leadership -- be it government, business, faith-based, community-based, or education -- plays a critical role in the success or failure of a city to embrace and sustain a culture of well-being.
"There are tangible policies that communities can adopt to actively cultivate and improve residents' well-being," said Dan Buettner, National Geographic Fellow and founder of Blue Zones LLC. "Policies that nudge people into healthy activities -- where it is easy to walk to the store, bike to a friend's house, get access to fresh produce, and be surrounded by healthy-minded, supportive friends -- are ones that make the healthy choice, the easy choice. Sustained transformation depends on building an environment and establishing social policies that support and reinforce these programs."
Communities such as Boulder (highest average rank across all reporting periods since 2008), Provo-Orem (most religious city, which helps its overall well-being), and San Jose-Sunnyvale-Santa Clara (the highest-ever rating for a large metro) can serve as best-practice examples for leaders of other cities. Key elements of community well-being, such as learning new and interesting things, providing safe places to exercise, routine trips to the dentist, and smoking cessation, are all key vanguards of high well-being locations. Leaders can leverage these learnings and advocate their execution in their own communities.
Survey Methods
Results are based on telephone interviews conducted as part of the Gallup-Healthways Well-Being Index survey Jan. 2-Dec. 29, 2012, and Jan. 2-Dec. 30, 2013, with a random sample of 531,630 adults, aged 18 and older, living in metropolitan areas in the 50 U.S. states and the District of Columbia, selected using random-digit-dial sampling. Two years of data were aggregated together to enable the same number of reportable cities as in prior years, when the overall annual data collection exceeded 350,000 interviews per year compared to 178,072 interviews conducted in 2013. At least 300 cases are required per metro area for reporting.
The metro areas referenced in this article are based on the Metropolitan Statistical Areas (MSAs) as defined by the U.S. Office of Management and Budget. In many cases, more than one city is included in the same MSA. The San Jose, Calif., metropolitan statistical area, for example, also includes the smaller nearby cities of Sunnyvale and Santa Clara in addition to San Jose itself. Each respondent is attributed to his or her MSA based on the self-report of his or her ZIP code, and all metro areas had at least 300 completed surveys in the 2012-2013 data collection period.
Maximum expected error ranges for the Well-Being Index and the sub-index scores vary according to MSA size, ranging from less than 1 point for the largest cities represented to ±1.5 points for the smallest cities.
Interviews are conducted with respondents on landline telephones and cellular phones, with interviews conducted in Spanish for respondents who are primarily Spanish-speaking. Each sample of national adults includes a minimum quota of 50% cellphone respondents and 50% landline respondents, with additional minimum quotas by time zone within region. Landline telephone and cellphone numbers are selected using random-digit-dial methods. Landline respondents are chosen at random within each household on the basis of which member had the most recent birthday.
Samples are weighted to match MSA demographics of gender, age, race, Hispanic ethnicity and education. Demographic weighting targets are based on the most recent Nielsen demographic estimates for the aged 18 and older population in each MSA. All reported margins of sampling error include the computed design effects for weighting.
In addition to sampling error, question wording and practical difficulties in conducting surveys can introduce error or bias into the findings of public opinion polls.
For more details on Gallup's polling methodology, visit www.gallup.com.
