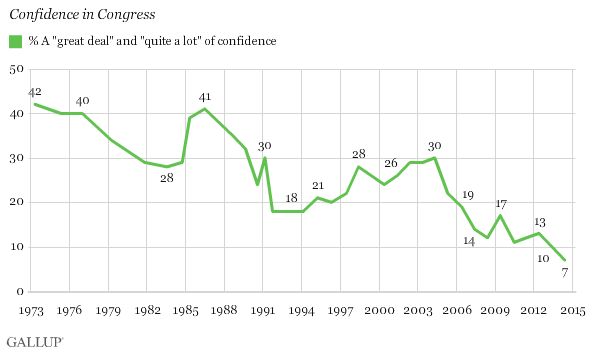
WASHINGTON, D.C. -- Americans' confidence in Congress has sunk to a new low. Seven percent of Americans say they have "a great deal" or "quite a lot" of confidence in Congress as an American institution, down from the previous low of 10% in 2013. This confidence is starkly different from the 42% in 1973, the first year Gallup began asking the question.

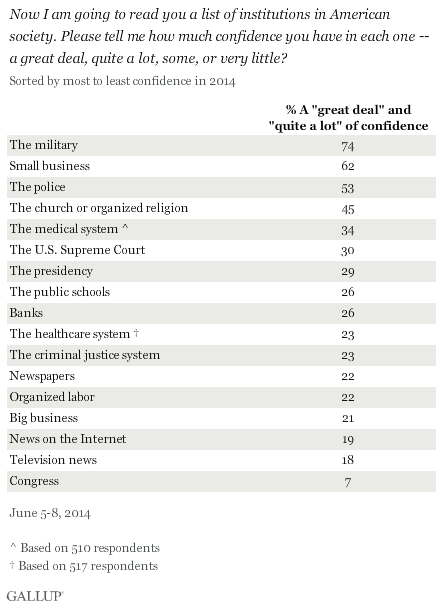
These results come from a June 5-8 Gallup poll that updated Americans' confidence in 17 U.S. institutions that Americans either read about or interact with in government, business, and society.
Americans' current confidence in Congress is not only the lowest on record, but also the lowest Gallup has recorded for any institution in the 41-year trend. This is also the first time Gallup has ever measured confidence in a major U.S. institution in the single digits. Currently, 4% of Americans say they have a great deal of confidence in Congress, and 3% have quite a lot of confidence. About one-third of Americans report having "some" confidence, while half have "very little," and another 7% volunteer that they have "none."
Confidence in Congress has varied over the years, with the highest levels in the low 40% range recorded in the 1970s and again in the mid-1980s. Confidence rose in the late 1990s and early 2000s, but has declined since 2004, culminating in this year's historic low.
Three in Four Americans Have High Confidence in the Military
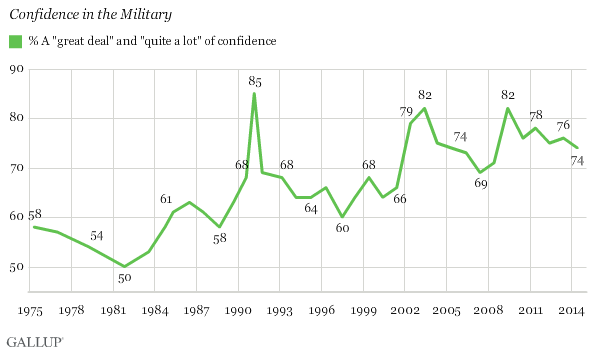
The military continues to rank at the top of this year's list, with 74% of Americans having either a great deal or quite a lot of confidence in the institution. Another 20% of Americans have "some" confidence in the military. Seven percent have very little or no confidence. The military has ranked at the top of the list all but one year since 1989. Prior to that, the church or organized religion, now with 45% confidence, typically finished first.

As is the case with confidence in Congress, Americans' confidence in many of these institutions has changed over time. The current 74% of Americans who have high levels of confidence in the military is actually lower than it has been in the past. Confidence in the military spiked in March 1991 to 85%, just after the first Persian Gulf War, but fell back through the 1990s. It also spiked in 2002 and 2003, after 9/11, and again in 2009, just before U.S. troops began withdrawing from Iraq.
Still, the current 74% confidence level is significantly higher than the average 67% rating given the military since it was first measured in 1975. The lowest was in 1981, when half of Americans had high levels of confidence in the military.

While confidence in the military has been higher than confidence in Congress since Gallup began tracking both institutions, they used to be much closer. Until the late 1980s, between 50% and 63% of Americans had high levels of confidence in the military. At the same time, between 28% and 42% of Americans had high levels of confidence in Congress. Since then, the percentage of Americans who have confidence in the military has generally increased, while confidence in Congress has decreased.
Bottom Line
The current 7% of Americans who place confidence in Congress is the lowest of the 17 institutions Gallup measured this year, and is the lowest Gallup has ever found for any of these institutions. The dearth of public confidence in their elected leaders on Capitol Hill is yet another sign of the challenges that could face incumbents in 2014's midterm elections -- as well as more broadly a challenge to the broad underpinnings of the nation's representative democratic system.
Survey Methods
Results for this Gallup poll are based on telephone interviews conducted June 5-8, 2014, a random sample of 1,027 adults, aged 18 and older, living in all 50 U.S. states and the District of Columbia.
For results based on the total sample of national adults, the margin of sampling error is ±4 percentage points at the 95% confidence level.
Interviews are conducted with respondents on landline telephones and cellular phones, with interviews conducted in Spanish for respondents who are primarily Spanish-speaking. Each sample of national adults includes a minimum quota of 50% cellphone respondents and 50% landline respondents, with additional minimum quotas by time zone within region. Landline and cellular telephone numbers are selected using random-digit-dial methods. Landline respondents are chosen at random within each household on the basis of which member had the most recent birthday.
Samples are weighted to correct for unequal selection probability, nonresponse, and double coverage of landline and cell users in the two sampling frames. They are also weighted to match the national demographics of gender, age, race, Hispanic ethnicity, education, region, population density, and phone status (cellphone only/landline only/both, and cellphone mostly). Demographic weighting targets are based on the most recent Current Population Survey figures for the aged 18 and older U.S. population. Phone status targets are based on the most recent National Health Interview Survey. Population density targets are based on the most recent U.S. census. All reported margins of sampling error include the computed design effects for weighting.
In addition to sampling error, question wording and practical difficulties in conducting surveys can introduce error or bias into the findings of public opinion polls.
View survey methodology, complete question responses, and trends.
For more details on Gallup's polling methodology, visit www.gallup.com.
