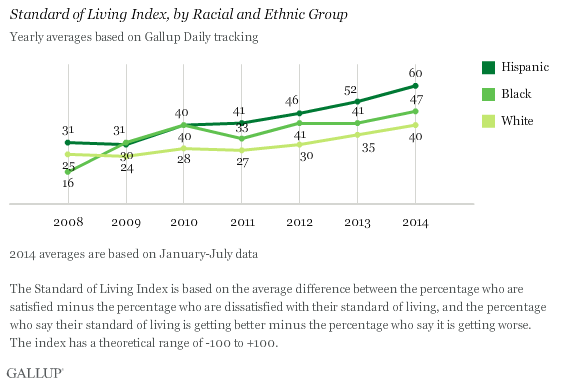
PRINCETON, NJ -- Blacks, whites, and Hispanics in the U.S. have grown steadily more positive about their standard of living since 2011, as measured by Gallup's Standard of Living Index. Hispanics have seen the greatest increase of the three groups, and are now significantly more upbeat about their standard of living than whites or blacks.

These results are based on yearly averages of Gallup Daily tracking interviews from January 2008 through July 2014. The 2014 data include interviews with more than 1,800 interviews each with blacks and Hispanics.
Gallup asks Americans if they are satisfied or dissatisfied with their standard of living, and if their standard of living is getting better or worse. The Standard of Living Index has a theoretical maximum of +100, which would indicate all respondents are satisfied rather than dissatisfied with their standard of living, and think it is getting better rather than worse. The theoretical minimum is -100.
All major U.S. racial and ethnic groups are generally positive about their standard of living. The index score among all Americans in 2014 to date is +44, which includes record monthly highs of +47 in May and July.
By comparison, the index score among all Americans was +24 in the recessionary year of 2008, including +31 among Hispanics, +25 among whites, and +16 among blacks. Blacks' perceptions of their standard of living greatly improved in 2009, coincident with Barack Obama's taking office as president, while whites' and Hispanics' ratings were generally stable.
Standard-of-living ratings rose among all three groups in 2010, before stalling in 2011, but the scores began to rise again in 2012 as the economy improved.
Hispanics Lead Whites, Blacks on Both Standard-of-Living Items
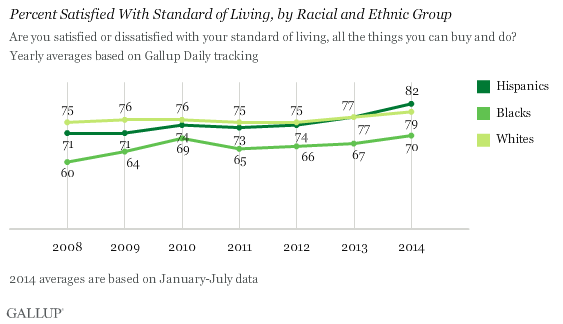
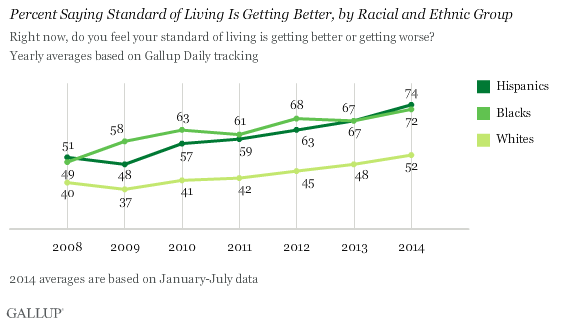
Hispanics have the highest score on Gallup's Standard of Living Index because they score higher than the other groups on both components of the index -- being satisfied rather than dissatisfied with their standard of living, and saying their standard of living is getting better rather than worse.
Currently, 82% of Hispanics say they are satisfied with their standard of living, compared with 79% of whites and 70% of blacks.
Meanwhile, 74% of Hispanics say their standard of living is getting better, slightly higher than the 72% of blacks who say this and significantly better than the 52% among whites.
All three groups' 2014 ratings on both standard-of-living items represent highs in Gallup's trend of more than six years. The full trends for each racial and ethnic group are shown on page 2.
Hispanics' Relative Youth a Key Factor in Standard-of-Living Ratings
Hispanics are more positive about their standard of living than whites or blacks, although that appears to be more of a perceptual difference rather than one grounded in reality. Whites report much higher annual household incomes on average than Hispanics or blacks. And Hispanics' unemployment rate is nearly twice that of whites.
One major reason Hispanics nevertheless rate their standard of living positively is that U.S. Hispanic adults as a whole tend to be much younger than whites or blacks, and younger Americans tend to be quite upbeat about their standard of living improving. Specifically, 85% of Americans between the ages of 18 and 29 say their standard of living is getting better, compared with 66% of those aged 30 to 49, 44% of those aged 50 to 64, and 33% of those aged 65 and older. These differences by age in standard-of-living ratings are apparent among blacks, Hispanics, and whites, but roughly three-quarters of U.S. Hispanic adults are younger than age 50, whereas a little more than half of U.S. non-Hispanic white adults are.
Also, although Hispanics tend to come from lower-income households, given the higher standard of living in the U.S. compared with most other countries, even a low income by U.S. standards may be significantly higher than what workers can earn in most other countries. Because a high percentage of U.S. Hispanics are recent immigrants, often from poorer countries in Latin America, their reference point may be one of a generally low standard of living. In contrast, non-immigrants in the U.S. would be more likely to evaluate their own standard of living against historical U.S. living standards.
Indeed, Hispanics whose annual household incomes are $36,000 or less are much more likely to be positive about their standard of living than whites or blacks at the same income level.
Implications
Although Hispanics are currently more upbeat about their standard of living than whites or blacks, this may be related more to the demographics of each group as well as their immigrant status. Thus, the differences in standard-of-living ratings by race and ethnic group may be something specific to the current generation of Hispanics living in the U.S. Those differences may not hold as U.S. Hispanics as a group get older, or as future generations of U.S. Hispanics become further removed from the original U.S. immigrants in their family tree.
Survey Methods
Results for this Gallup poll are based on telephone interviews conducted January-July 2014, on the Gallup Daily tracking survey, with a random sample of 20,616 adults, aged 18 and older, living in all 50 U.S. states and the District of Columbia.
For results based on the total sample of national adults, the margin of sampling error is ±1 percentage point at the 95% confidence level.
For results based on the total sample of 15,491 non-Hispanic whites, the margin of sampling error is ±1 percentage point at the 95% confidence level.
For results based on the total sample of 1,836 non-Hispanic blacks, the margin of sampling error is ±3 percentage points at the 95% confidence level.
For results based on the total sample of 1,835 Hispanics, the margin of sampling error is ±3 percentage points at the 95% confidence level.
Interviews are conducted with respondents on landline telephones and cellular phones, with interviews conducted in Spanish for respondents who are primarily Spanish-speaking. Each sample of national adults includes a minimum quota of 50% cellphone respondents and 50% landline respondents, with additional minimum quotas by time zone within region. Landline and cellular telephone numbers are selected using random-digit-dial methods. Landline respondents are chosen at random within each household on the basis of which member had the most recent birthday.
Samples are weighted to correct for unequal selection probability, nonresponse, and double coverage of landline and cell users in the two sampling frames. They are also weighted to match the national demographics of gender, age, race, Hispanic ethnicity, education, region, population density, and phone status (cellphone only/landline only/both, and cellphone mostly). Demographic weighting targets are based on the most recent Current Population Survey figures for the aged 18 and older U.S. population. Phone status targets are based on the most recent National Health Interview Survey. Population density targets are based on the most recent U.S. census. All reported margins of sampling error include the computed design effects for weighting.
In addition to sampling error, question wording and practical difficulties in conducting surveys can introduce error or bias into the findings of public opinion polls.
For more details on Gallup's polling methodology, visit www.gallup.com.


