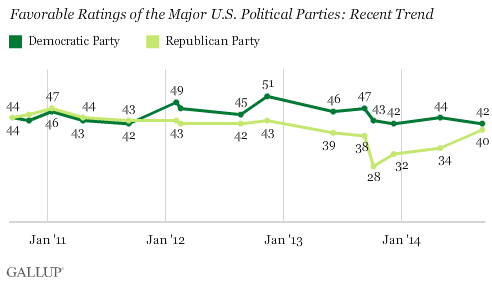
PRINCETON, NJ -- Americans' views of the Democratic and Republican parties are now similar, mainly because of their more positive ratings of the GOP. Since bottoming out at 28% last fall during the government shutdown, Americans' opinions of the Republican Party have grown more positive and are nearly back to pre-shutdown levels. Over the same time period, ratings of the Democratic Party have generally held steady.

Americans view both parties negatively overall, with a 40% favorable and 57% unfavorable rating for the Republican Party, and a 42% favorable and 54% unfavorable rating for the Democratic Party. This net-negativity toward both major political parties has generally been the case since 2010, apart from President Barack Obama's re-election year in 2012, when on several occasions Americans had slightly more positive than negative views of the Democrats.
There are encouraging and discouraging signs for both parties in the latest poll, conducted Sept. 4-7, just two months before the important midterm elections.
Americans have typically rated the Democratic Party more positively than the Republican Party since the question was first asked in 1992, so the current parity between the two is a positive sign for the GOP and a negative one for the Democratic Party. Indeed, current opinions of the Democratic Party are among the worst Gallup has measured in the past 20 years. The only time Gallup measured a lower favorable rating for the Democrats was 41% in late March 2010, just after Obama signed the Affordable Care Act into law.
At the same time, Democrats can take some solace in the fact that Americans are not rating the GOP any more positively than they rate the Democratic Party, even at a time when Americans believe the Republican Party is better than the Democratic Party both at keeping the U.S. prosperous and at keeping the U.S. secure from international threats.
The situation is similar to what occurred in 2010. Even as Republicans were making large gains in federal and state offices nationwide, Americans did not view the GOP any more positively than the Democratic Party. As such, the Republicans may have merely benefitted from public frustration with Obama and the Democrats in 2010, rather than having been truly embraced by Americans. Thus, if Republicans do well on Election Day this year it does not necessarily equate to a voter mandate for the party and its policies.
All Partisan Groups More Positive toward GOP
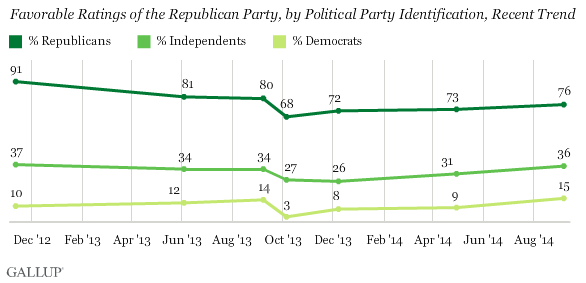
The gains, or perhaps recovery, in the GOP's image over the past year are evident among Democrats, independents, and Republicans. Notably, Republicans' favorable views of their own party are still not back to pre-shutdown levels.

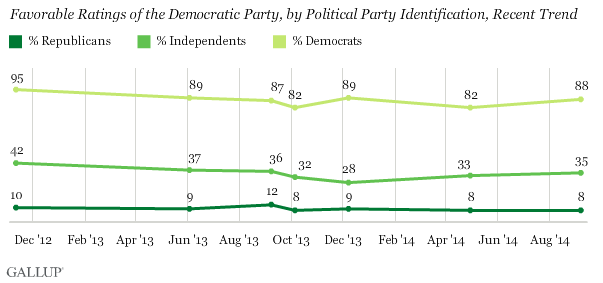
As would be expected given the stability in overall views of the Democratic Party, the ratings of it by respondents' political identity are also generally steady over the past 12 months. However, Democrats and independents are less positive toward the Democratic Party than they were in late 2012, after Obama's re-election.

Favorable ratings of the Democratic Party are more politically polarized than ratings of the Republican Party. There is an 80-percentage-point party gap in ratings of the Democratic Party, based on an 88% favorable rating from Democrats compared with an 8% favorable rating from Republicans. The comparable gap in ratings of the Republican Party is 61 points, due to 76% favorable rating of the GOP among Republicans and 15% among Democrats.
Implications
Americans now view the Republican Party as favorably as they view the Democratic Party. While the Democratic Party's rating has been steady, the GOP's rating has improved, restoring their image to what it was prior to the federal government shutdown in the fall of 2013. But neither party is viewed positively overall, and thus voters may be choosing between two unappealing options this fall rather than between two appealing ones, and thus claims of a voter mandate by the party that does better in the Nov. 4 elections may be more wishful thinking than reality.
Survey Methods
Results for this Gallup poll are based on telephone interviews conducted Sept. 4-7, 2014, with a random sample of 1,017 adults, aged 18 and older, living in all 50 U.S. states and the District of Columbia.
For results based on the total sample of national adults, the margin of sampling error is ±4 percentage points at the 95% confidence level.
Interviews are conducted with respondents on landline telephones and cellular phones, with interviews conducted in Spanish for respondents who are primarily Spanish-speaking. Each sample of national adults includes a minimum quota of 50% cellphone respondents and 50% landline respondents, with additional minimum quotas by time zone within region. Landline and cellular telephone numbers are selected using random-digit-dial methods. Landline respondents are chosen at random within each household on the basis of which member had the most recent birthday.
Samples are weighted to correct for unequal selection probability, nonresponse, and double coverage of landline and cell users in the two sampling frames. They are also weighted to match the national demographics of gender, age, race, Hispanic ethnicity, education, region, population density, and phone status (cellphone only/landline only/both, and cellphone mostly). Demographic weighting targets are based on the most recent Current Population Survey figures for the aged 18 and older U.S. population. Phone status targets are based on the most recent National Health Interview Survey. Population density targets are based on the most recent U.S. census. All reported margins of sampling error include the computed design effects for weighting.
In addition to sampling error, question wording and practical difficulties in conducting surveys can introduce error or bias into the findings of public opinion polls.
View survey methodology, complete question responses, and trends.
For more details on Gallup's polling methodology, visit www.gallup.com.
