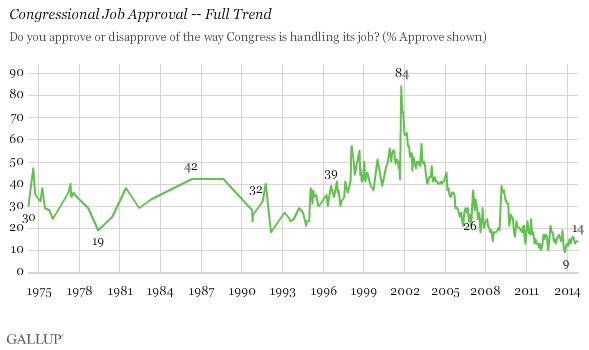
WASHINGTON, D.C. -- Less than one month before the 2014 midterm elections, 14% of Americans approve of the way Congress is handling its job. This is unchanged from September and is only five percentage points above the historical low of 9% found in November 2013.

Congressional job approval in October matches the 14% average found so far in 2014.
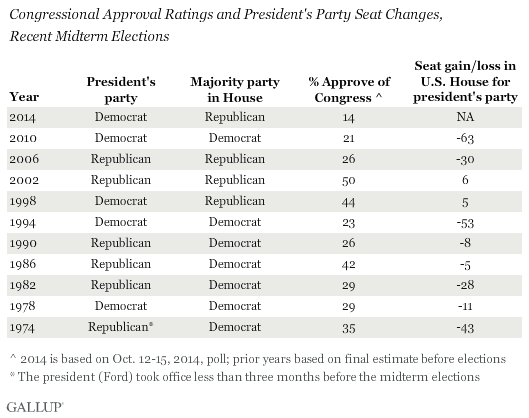
The current approval figure is the lowest found in October of a midterm election year since Gallup began tracking this measure in 1974. Gallup has found that low congressional approval ratings before midterm elections are linked to higher seat turnover, especially for members of the president's party. For example, congressional job approval in October was 21% in 2010, and 23% in 1994, two years when the president's party lost a large number of seats. However, in other years when approval of Congress was in the 20% range, seat loss was not as extreme. This suggests that although low congressional approval is related to seat loss for the president's party, it is not a perfect predictor of what will happen in the upcoming elections. There likely are other factors at play, such as low presidential job approval and whether the president's party is the majority party in Congress.

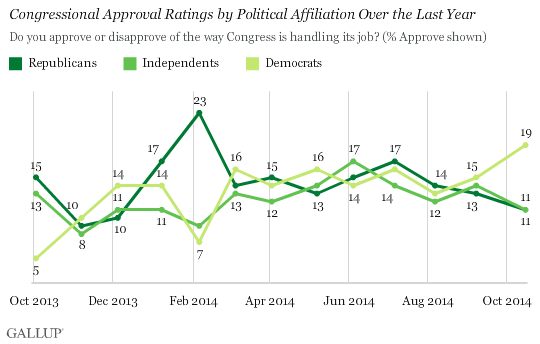
Democrats are slightly more likely to approve of Congress, at 19% in October, than are Republicans and independents, both at 11%. This gap is the largest it has been since February; from March to September, there was little difference in congressional approval by party identification. An increase in approval among Democrats is mostly responsible for this month's gap.

Bottom Line
In the fast-approaching midterm elections, all 435 House seats and 36 Senate seats are up for election. While Americans get to vote only for the member of Congress in their own district and, if applicable this year, a senator or senators from their own state, the Congress' dismal approval rating could signal high congressional seat turnover, based on history. That will likely fall disproportionately on Democrats because voters often turn their frustrations on members of the president's political party.
One variable working against a big shakeup is the current divided party control of Congress. In contrast to most past elections, those unhappy with Congress cannot as clearly direct their frustrations at one party because currently, there is divided party control of Congress. This blurred line of responsibility -- and the presently small likelihood that the Democrats will gain control of the House and maintain control of the Senate, along with the presidency, after the elections -- may be why voters are not as motivated to show up at the polls this year as in past elections, when frustration with Congress was high.
Survey Methods
Results for this Gallup poll are based on telephone interviews conducted Oct. 12-15, 2014, with a random sample of 1,017 adults, aged 18 and older, living in all 50 U.S. states and the District of Columbia.
For results based on the total sample of national adults, the margin of sampling error is ±4 percentage points at the 95% confidence level.
Interviews are conducted with respondents on landline telephones and cellular phones, with interviews conducted in Spanish for respondents who are primarily Spanish-speaking. Each sample of national adults includes a minimum quota of 50% cellphone respondents and 50% landline respondents, with additional minimum quotas by time zone within region. Landline and cellular telephone numbers are selected using random-digit-dial methods. Landline respondents are chosen at random within each household on the basis of which member had the most recent birthday.
Samples are weighted to correct for unequal selection probability, nonresponse, and double coverage of landline and cell users in the two sampling frames. They are also weighted to match the national demographics of gender, age, race, Hispanic ethnicity, education, region, population density, and phone status (cellphone only/landline only/both, and cellphone mostly). Demographic weighting targets are based on the most recent Current Population Survey figures for the aged 18 and older U.S. population. Phone status targets are based on the most recent National Health Interview Survey. Population density targets are based on the most recent U.S. census. All reported margins of sampling error include the computed design effects for weighting.
In addition to sampling error, question wording and practical difficulties in conducting surveys can introduce error or bias into the findings of public opinion polls.
For more details on Gallup's polling methodology, visit www.gallup.com.

